Joshua A. Shapiro 0000-0002-6224-0347
· jashapiro
· jashapiro
Childhood Cancer Data Lab, Alex’s Lemonade Stand Foundation, Bala Cynwyd, PA, 19004, USA
· Funded by Alex’s Lemonade Stand Foundation Childhood Cancer Data Lab (CCDL)
Krutika S. Gaonkar 0000-0003-0838-2405
· kgaonkar6
· aggokittu
Center for Data-Driven Discovery in Biomedicine, Children’s Hospital of Philadelphia, Philadelphia, PA, 19104, USA; Division of Neurosurgery, Children’s Hospital of Philadelphia, Philadelphia, PA, 19104, USA; Department of Bioinformatics and Health Informatics, Children’s Hospital of Philadelphia, Philadelphia, PA, 19104, USA
Stephanie J. Spielman 0000-0002-9090-4788
· sjspielman
· stephspiel
Childhood Cancer Data Lab, Alex’s Lemonade Stand Foundation, Bala Cynwyd, PA, 19004, USA+; Rowan University, Glassboro, NJ, 08028, USA
· Funded by Alex’s Lemonade Stand Foundation Childhood Cancer Data Lab (CCDL)
+Current affiliation
Candace L. Savonen 0000-0001-6331-7070
· cansavvy
· cansavvy
Childhood Cancer Data Lab, Alex’s Lemonade Stand Foundation, Bala Cynwyd, PA, 19004, USA; Fred Hutchinson Cancer Center, Seattle, WA, 98109, USA+
· Funded by Alex’s Lemonade Stand Foundation Childhood Cancer Data Lab (CCDL)
+Current affiliation
Chante J. Bethell 0000-0001-9653-8128
· cbethell
· cjbethell
Childhood Cancer Data Lab, Alex’s Lemonade Stand Foundation, Bala Cynwyd, PA, 19004, USA
· Funded by Alex’s Lemonade Stand Foundation Childhood Cancer Data Lab (CCDL)
Run Jin 0000-0002-8958-9266
· runjin326
· runjin
Center for Data-Driven Discovery in Biomedicine, Children’s Hospital of Philadelphia, Philadelphia, PA, 19104, USA; Division of Neurosurgery, Children’s Hospital of Philadelphia, Philadelphia, PA, 19104, USA
Komal S. Rathi 0000-0001-5534-6904
· komalsrathi
· komalsrathi
Center for Data-Driven Discovery in Biomedicine, Children’s Hospital of Philadelphia, Philadelphia, PA, 19104, USA; Department of Bioinformatics and Health Informatics, Children’s Hospital of Philadelphia, Philadelphia, PA, 19104, USA
Yuankun Zhu 0000-0002-2455-9525
· yuankunzhu
· zhuyuankun
Center for Data-Driven Discovery in Biomedicine, Children’s Hospital of Philadelphia, Philadelphia, PA, 19104, USA; Division of Neurosurgery, Children’s Hospital of Philadelphia, Philadelphia, PA, 19104, USA
Laura E. Egolf 0000-0002-7103-4801
· LauraEgolf
· LauraEgolf
Cell and Molecular Biology Graduate Group, Perelman School of Medicine at the University of Pennsylvania, Philadelphia, PA, 19104, USA; Division of Oncology, Children’s Hospital of Philadelphia, Philadelphia, PA, 19104, USA
Bailey K. Farrow 0000-0001-6727-6333
· baileyckelly
Center for Data-Driven Discovery in Biomedicine, Children’s Hospital of Philadelphia, Philadelphia, PA, 19104, USA; Division of Neurosurgery, Children’s Hospital of Philadelphia, Philadelphia, PA, 19104, USA
Daniel P. Miller 0000-0002-2032-4358
· dmiller15
Center for Data-Driven Discovery in Biomedicine, Children’s Hospital of Philadelphia, Philadelphia, PA, 19104, USA; Division of Neurosurgery, Children’s Hospital of Philadelphia, Philadelphia, PA, 19104, USA
Yang Yang 0000-0002-5560-2936
· yangyangclover
Ben May Department for Cancer Research, University of Chicago, Chicago, IL, 60637, USA
Tejaswi Koganti 0000-0002-7733-6480
· tkoganti
Center for Data-Driven Discovery in Biomedicine, Children’s Hospital of Philadelphia, Philadelphia, PA, 19104, USA; Division of Neurosurgery, Children’s Hospital of Philadelphia, Philadelphia, PA, 19104, USA
Nighat Noureen 0000-0001-7495-8201
· NNoureen
Greehey Children’s Cancer Research Institute, UT Health San Antonio, San Antonio, TX, 78229, USA
Mateusz P. Koptyra 0000-0002-3857-6633
· mkoptyra
· koptyram
Center for Data-Driven Discovery in Biomedicine, Children’s Hospital of Philadelphia, Philadelphia, PA, 19104, USA; Division of Neurosurgery, Children’s Hospital of Philadelphia, Philadelphia, PA, 19104, USA
Nhat Duong 0000-0003-2852-4263
· fingerfen
· asiannhat
Department of Bioinformatics and Health Informatics, Children’s Hospital of Philadelphia, Philadelphia, PA, 19104, USA
Mariarita Santi 0000-0002-6728-3450
Department of Pathology and Laboratory Medicine, Children’s Hospital of Philadelphia, Philadelphia, PA, 19104, USA; Department of Pathology and Laboratory Medicine, University of Pennsylvania Perelman School of Medicine, Philadelphia, PA, 19104, USA
Jung Kim 0000-0001-6274-2841
Clinical Genetics Branch, Division of Cancer Epidemiology and Genetics, National Cancer Institute, Rockville, MD 20850, USA
Shannon Robins 0000-0003-0594-1953
Center for Data-Driven Discovery in Biomedicine, Children’s Hospital of Philadelphia, Philadelphia, PA, 19104, USA; Division of Neurosurgery, Children’s Hospital of Philadelphia, Philadelphia, PA, 19104, USA
Phillip B. Storm 0000-0002-7964-2449
Center for Data-Driven Discovery in Biomedicine, Children’s Hospital of Philadelphia, Philadelphia, PA, 19104, USA; Division of Neurosurgery, Children’s Hospital of Philadelphia, Philadelphia, PA, 19104, USA
· Funded by Alex’s Lemonade Stand Foundation (Catalyst); Children’s Hospital of Philadelphia Division of Neurosurgery
Stephen C. Mack 0000-0001-9620-4742
Department of Developmental Neurobiology, St. Jude Children’s Research Hospital, Memphis, TN, 38105, USA
Jena V. Lilly 0000-0003-1439-6045
· jvlilly
· jvlilly
Center for Data-Driven Discovery in Biomedicine, Children’s Hospital of Philadelphia, Philadelphia, PA, 19104, USA; Division of Neurosurgery, Children’s Hospital of Philadelphia, Philadelphia, PA, 19104, USA
Hongbo M. Xie 0000-0003-2223-0029
· xiehongbo
· xiehb
Department of Bioinformatics and Health Informatics, Children’s Hospital of Philadelphia, Philadelphia, PA, 19104, USA
Payal Jain 0000-0002-5914-9083
· jainpayal022
· jainpayal022
Center for Data-Driven Discovery in Biomedicine, Children’s Hospital of Philadelphia, Philadelphia, PA, 19104, USA; Division of Neurosurgery, Children’s Hospital of Philadelphia, Philadelphia, PA, 19104, USA
Pichai Raman 0000-0001-6948-2157
· pichairaman
· PichaiRaman
Center for Data-Driven Discovery in Biomedicine, Children’s Hospital of Philadelphia, Philadelphia, PA, 19104, USA; Department of Bioinformatics and Health Informatics, Children’s Hospital of Philadelphia, Philadelphia, PA, 19104, USA
Brian R. Rood
Children’s National Research Institute, Washington, D.C.; George Washington University School of Medicine and Health Sciences, Washington, D.C., 20052, USA
Rishi R. Lulla 0000-0003-4109-2207
Division of Hematology/Oncology, Hasbro Children’s Hospital, Providence, Rhode Island, 02903, USA; Department of Pediatrics, The Warren Alpert School of Brown University, Providence, Rhode Island, 02912, USA
Javad Nazarian 0000-0002-1951-9828
Children’s National Research Institute, Washington, D.C., 20012, USA; George Washington University School of Medicine and Health Sciences, Washington, D.C., 20052, USA; University of Zurich, Department of Pediatrics, Zurich, Switzerland
Adam A. Kraya 0000-0002-8526-5694
· aadamk
Center for Data-Driven Discovery in Biomedicine, Children’s Hospital of Philadelphia, Philadelphia, PA, 19104, USA; Division of Neurosurgery, Children’s Hospital of Philadelphia, Philadelphia, PA, 19104, USA
Zalman Vaksman
Division of Oncology, Children’s Hospital of Philadelphia, Philadelphia, PA, 19104, USA
Allison P. Heath 0000-0002-2583-9668
· allisonheath
· allig8r
Center for Data-Driven Discovery in Biomedicine, Children’s Hospital of Philadelphia, Philadelphia, PA, 19104, USA; Division of Neurosurgery, Children’s Hospital of Philadelphia, Philadelphia, PA, 19104, USA
· Funded by NIH U2C HL138346-03; NCI/NIH Contract No. 75N91019D00024, Task Order No. 75N91020F00003; Australian Government, Department of Education
Cassie Kline 0000-0001-7765-7690
· cassiekmd
Division of Oncology, Children’s Hospital of Philadelphia, Philadelphia, PA, 19104, USA
Laura Scolaro
Division of Oncology, Children’s Hospital of Philadelphia, Philadelphia, PA, 19104, USA
Angela N. Viaene 0000-0001-6430-8360
Department of Pathology and Laboratory Medicine, Children’s Hospital of Philadelphia, Philadelphia, PA, 19104, USA; Department of Pathology and Laboratory Medicine, University of Pennsylvania Perelman School of Medicine, Philadelphia, PA, 19104, USA
Xiaoyan Huang 0000-0001-7267-4512
· HuangXiaoyan0106
Center for Data-Driven Discovery in Biomedicine, Children’s Hospital of Philadelphia, Philadelphia, PA, 19104, USA; Division of Neurosurgery, Children’s Hospital of Philadelphia, Philadelphia, PA, 19104, USA
Gregory P. Way 0000-0002-0503-9348
· gwaybio
· gwaybio
Department of Biomedical Informatics, University of Colorado School of Medicine, Aurora, CO, 80045, USA
Steven M. Foltz 0000-0002-9526-8194
· envest
Department of Systems Pharmacology and Translational Therapeutics, University of Pennsylvania, Philadelphia, PA, 19104, USA; Childhood Cancer Data Lab, Alex’s Lemonade Stand Foundation, Bala Cynwyd, PA, 19004, USA
· Funded by Alex’s Lemonade Stand Foundation GR-000002471; National Institutes of Health K12GM081259
Bo Zhang 0000-0002-0743-5379
· zhangb1
Center for Data-Driven Discovery in Biomedicine, Children’s Hospital of Philadelphia, Philadelphia, PA, 19104, USA; Division of Neurosurgery, Children’s Hospital of Philadelphia, Philadelphia, PA, 19104, USA
Anna R. Poetsch 0000-0003-3056-4360
· arpoe
· APoetsch
Biotechnology Center, Technical University Dresden, Germany; National Center for Tumor Diseases, Dresden, Germany
· Funded by The St. Anna Kinderkrebsforschung, Austria; The Mildred Scheel Early Career Center Dresden P2, funded by the German Cancer Aid
Sabine Mueller 0000-0002-3452-5150
Department of Neurology, Neurosurgery and Pediatrics, University of California, San Francisco, San Francisco, CA, 94115, USA
Brian M. Ennis 0000-0002-2653-5009
· bmennis
Center for Data-Driven Discovery in Biomedicine, Children’s Hospital of Philadelphia, Philadelphia, PA, 19104, USA; Division of Neurosurgery, Children’s Hospital of Philadelphia, Philadelphia, PA, 19104, USA
Michael Prados 0000-0002-9630-2075
University of California, San Francisco, San Francisco, CA, USA, 94115, USA
Sharon J. Diskin 0000-0002-7200-8939
· sdiskin
· sjdiskin
Division of Oncology, Children’s Hospital of Philadelphia, Philadelphia, PA, 19104, USA; Department of Pediatrics, University of Pennsylvania, Philadelphia, PA, 19104, USA
Siyuan Zheng 0000-0002-1031-9424
· syzheng
· zhengsiyuan
Greehey Children’s Cancer Research Institute, UT Health San Antonio, San Antonio, TX, 78229, USA
Yiran Guo 0000-0002-6549-8589
· Yiran-Guo
· YiranGuo3
Center for Data-Driven Discovery in Biomedicine, Children’s Hospital of Philadelphia, Philadelphia, PA, 19104, USA
Shrivats Kannan 0000-0002-1460-920X
· shrivatsk
· kshrivats
Center for Data-Driven Discovery in Biomedicine, Children’s Hospital of Philadelphia, Philadelphia, PA, 19104, USA; Division of Neurosurgery, Children’s Hospital of Philadelphia, Philadelphia, PA, 19104, USA
Angela J. Waanders 0000-0002-0571-2889
· awaanders
Division of Hematology, Oncology, Neuro-Oncology, and Stem Cell Transplant, Ann & Robert H Lurie Children’s Hospital of Chicago, Chicago, IL, 60611, USA; Department of Pediatrics, Northwestern University Feinberg School of Medicine, Chicago, IL, 60611, USA
Ashley S. Margol 0000-0002-3038-8005
Division of Hematology and Oncology, Children’s Hospital of Los Angeles, Los Angeles, CA, 90027, USA; Department of Pediatrics, Keck School of Medicine of University of Southern California, Los Angeles, CA, 90033, USA
Meen Chul Kim 0000-0002-0308-783X
· liberaliscomputing
Center for Data-Driven Discovery in Biomedicine, Children’s Hospital of Philadelphia, Philadelphia, PA, 19104, USA; Division of Neurosurgery, Children’s Hospital of Philadelphia, Philadelphia, PA, 19104, USA
Derek Hanson 0000-0002-0024-5142
Hackensack Meridian School of Medicine, Nutley, NJ, 07110, USA; Hackensack University Medical Center, Hackensack, NJ, 07601, USA
Nicholas Van Kuren 0000-0002-7414-9516
· nicholasvk
Center for Data-Driven Discovery in Biomedicine, Children’s Hospital of Philadelphia, Philadelphia, PA, 19104, USA; Division of Neurosurgery, Children’s Hospital of Philadelphia, Philadelphia, PA, 19104, USA
Jessica Wong 0000-0003-1508-7631
· wongjessica93
· jessicawongbfx
Center for Data-Driven Discovery in Biomedicine, Children’s Hospital of Philadelphia, Philadelphia, PA, 19104, USA; Division of Neurosurgery, Children’s Hospital of Philadelphia, Philadelphia, PA, 19104, USA
Rebecca S. Kaufman 0000-0001-8535-9730
· rebkau
Division of Oncology, Children’s Hospital of Philadelphia, Philadelphia, PA, 19104, USA; Department of Bioinformatics and Health Informatics, Children’s Hospital of Philadelphia, Philadelphia, PA, 19104, USA
Noel Coleman 0000-0001-6454-1285
Center for Data-Driven Discovery in Biomedicine, Children’s Hospital of Philadelphia, Philadelphia, PA, 19104, USA; Division of Neurosurgery, Children’s Hospital of Philadelphia, Philadelphia, PA, 19104, USA
Christopher Blackden
· devbyaccident
Center for Data-Driven Discovery in Biomedicine, Children’s Hospital of Philadelphia, Philadelphia, PA, 19104, USA; Division of Neurosurgery, Children’s Hospital of Philadelphia, Philadelphia, PA, 19104, USA
Kristina A. Cole 0000-0003-0064-2882
Division of Oncology, Children’s Hospital of Philadelphia, Philadelphia, PA, 19104, USA; Department of Pediatrics, University of Pennsylvania, Philadelphia, PA, 19104, USA; Abramson Family Cancer Research Institute, Perelman School of Medicine at the University of Pennsylvania, Philadelphia, PA, Philadelphia, PA, 19104, USA
Jennifer L. Mason
· jenn0307
· jenn0307
Center for Data-Driven Discovery in Biomedicine, Children’s Hospital of Philadelphia, Philadelphia, PA, 19104, USA; Division of Neurosurgery, Children’s Hospital of Philadelphia, Philadelphia, PA, 19104, USA
Peter J. Madsen 0000-0001-9266-3685
· petermadsenmd
Division of Neurosurgery, Children’s Hospital of Philadelphia, Philadelphia, PA, 19104, USA; Center for Data-Driven Discovery in Biomedicine, Children’s Hospital of Philadelphia, Philadelphia, PA, 19104, USA
Carl J. Koschmann 0000-0002-0825-7615
Department of Pediatrics, University of Michigan Health, Ann Arbor, MI, 48105, USA; Pediatric Hematology Oncology, Mott Children’s Hospital, Ann Arbor, MI, 48109, USA
Douglas R. Stewart 0000-0001-8193-1488
Clinical Genetics Branch, Division of Cancer Epidemiology and Genetics, National Cancer Institute, Rockville, MD 20850
Eric Wafula 0000-0001-8073-3797
· ewafula
Department of Bioinformatics and Health Informatics, Children’s Hospital of Philadelphia, Philadelphia, PA, 19104, USA
Miguel A. Brown 0000-0001-6782-1442
· migbro
· migbro
Center for Data-Driven Discovery in Biomedicine, Children’s Hospital of Philadelphia, Philadelphia, PA, 19104, USA; Division of Neurosurgery, Children’s Hospital of Philadelphia, Philadelphia, PA, 19104, USA
Adam C. Resnick 0000-0003-0436-4189
· adamcresnick
· adamcresnick
Center for Data-Driven Discovery in Biomedicine, Children’s Hospital of Philadelphia, Philadelphia, PA, 19104, USA; Division of Neurosurgery, Children’s Hospital of Philadelphia, Philadelphia, PA, 19104, USA
· Funded by Alex’s Lemonade Stand Foundation (Catalyst); Children’s Brain Tumor Network; NIH 3P30 CA016520-44S5, U2C HL138346-03, U24 CA220457-03; NCI/NIH Contract No. 75N91019D00024, Task Order No. 75N91020F00003; Children’s Hospital of Philadelphia Division of Neurosurgery
Casey S. Greene 0000-0001-8713-9213
· cgreene
· greenescientist
Department of Systems Pharmacology and Translational Therapeutics, Perelman School of Medicine, University of Pennsylvania, Philadelphia, PA, 19104, USA; Childhood Cancer Data Lab, Alex’s Lemonade Stand Foundation, Bala Cynwyd, PA, 19004, USA; Center for Health AI, University of Colorado School of Medicine, Aurora, CO, 80045, USA+; Department of Biomedical Informatics, University of Colorado School of Medicine, Aurora, CO, 80045, USA+
· Funded by Alex’s Lemonade Stand Foundation Childhood Cancer Data Lab (CCDL)
+Current affiliation
Jo Lynne Rokita^✉ 0000-0003-2171-3627
· jharenza
· jolynnerokita
Center for Data-Driven Discovery in Biomedicine, Children’s Hospital of Philadelphia, Philadelphia, PA, 19104, USA; Division of Neurosurgery, Children’s Hospital of Philadelphia, Philadelphia, PA, 19104, USA; Department of Bioinformatics and Health Informatics, Children’s Hospital of Philadelphia, Philadelphia, PA, 19104, USA
· Funded by Alex’s Lemonade Stand Foundation (Young Investigator, Catalyst); NCI/NIH Contract No. 75N91019D00024, Task Order No. 75N91020F00003
Jaclyn N. Taroni✉ 0000-0003-4734-4508
· jaclyn-taroni
· jaclyn_taroni
Childhood Cancer Data Lab, Alex’s Lemonade Stand Foundation, Bala Cynwyd, PA, 19004, USA
· Funded by Alex’s Lemonade Stand Foundation Childhood Cancer Data Lab (CCDL)
The OpenPBTA is a global, collaborative open-science initiative which brought together researchers and clinicians to genomically characterize 1,074 pediatric brain tumors and 22 patient-derived cell lines.
Shapiro, et. al create over 40 open-source, scalable modules to perform cancer genomics analyses and provide a richly-annotated somatic dataset across 58 brain tumor histologies.
The OpenPBTA framework can be used as a model for large-scale data integration to inform basic research, therapeutic target identification, and clinical translation.
Highlights
OpenPBTA collaborative analyses establish resource for 1,074 pediatric brain tumors
NGS-based WHO-aligned integrated diagnoses generated for 644 of 1,074 tumors
RNA-Seq analysis infers medulloblastoma subtypes, TP53 status, and telomerase activity
OpenPBTA will accelerate therapeutic translation of genomic insights
Summary
Pediatric brain and spinal cancers are collectively the leading disease-related cause of death in children, thus we urgently need curative therapeutic strategies for these tumors.
To accelerate such discoveries, the Children’s Brain Tumor Network (CBTN) and Pacific Pediatric Neuro-Oncology Consortium (PNOC) created a systematic process for tumor biobanking, model generation, and sequencing with immediate access to harmonized data.
We leverage these data to establish OpenPBTA, an open collaborative project with over 40 scalable analysis modules that genomically characterize 1,074 pediatric brain tumors.
Transcriptomic classification reveals universal TP53 dysregulation in mismatch repair-deficient hypermutant high-grade gliomas and TP53 loss as a significant marker for poor overall survival in ependymomas and H3 K28-mutant diffuse midline gliomas.
Already being actively applied to other pediatric cancers and PNOC molecular tumor board decision-making, OpenPBTA is an invaluable resource to the pediatric oncology community.
Pediatric brain and spinal cord tumors are collectively the second most common malignancy in children after leukemia, representing the leading disease-related cause of death in children1.
Five-year survival rates vary widely across different histologic and molecular classifications of brain tumors.
For example, most high-grade gliomas carry a universally fatal prognosis, while children with pilocytic astrocytoma have an estimated 10-year survival rate of 92%2.
Recent estimates suggest that children and adolescents aged 0-19 with brain tumors in the United States lose an average 47,631 years of life3.
The low survival rates for some pediatric tumors are multifactorial, explained partly by our lack of comprehensive understanding of ever-evolving brain tumor molecular subtypes, difficulty drugging these tumors, and shortage of drugs specifically labeled for pediatric malignancies.
Historically, fatal inoperable brain tumors, such as diffuse intrinsic pontine gliomas (DIPGs), were not routinely biopsied due to perceived biopsy risks and the paucity of therapeutic options.
Thus, combined with rare incidences of pediatric tumors in the first place, limited availability of tissue for developing patient-derived cell lines and mouse models has hindered research.
To address these barriers, multiple national and international consortia have collaborated to uniformly collect clinically-annotated surgical biosamples and associated germline materials through both observational and interventional clinical trials.
The Pediatric Brain Tumor Atlas (PBTA) initiative established in 2018 by the Children’s Brain Tumor Network (CBTN, cbtn.org)4 and the Pacific Pediatric Neuro-Oncology Consortium (PNOC, pnoc.us) built upon 12 years of enrollment, sample collection, and clinical followup across over 30 institutions.
Just as cooperation accelerates specimens and data sharing, collaboration among computational researchers, bench scientists, clinicians, and pathologists is critical for rigorous genomic analysis.
Although there has been significant progress elucidating genomic bases of pediatric brain tumor formation and progression, translating therapeutic agents to phase II or III clinical trials and subsequent FDA approvals have not kept pace.
Within the last 20 years, the FDA has approved only seven targeted agents for treating pediatric brain tumors5.
This is partly due to pharmaceutical company priorities, posing challenges for researchers to obtain therapeutic agents for pediatric clinical trials.
Critically, since August 2020, an amendment to the Pediatric Research Equity Act called the “Research to Accelerate Cures and Equity (RACE) for Children Act” mandates that all new adult oncology drugs also be tested in children when the molecular target exists in a childhood cancer.
The RACE Act, coupled with genomics advances to identify putative molecular targets in pediatric cancers, will accelerate identification of previously-overlooked but effective therapeutic options for pediatric diseases.
We anticipated that a model of open collaboration would enhance the PBTA’s value and provide a framework for ongoing analysis of pediatric brain tumor datasets.
Leveraging diverse scientific and analytical expertise, we established the OpenPBTA, which employs an open science model with features such as analytical code review6,7 and continuous integration7,8, thereby ensuring reproducibility throughout the project’s lifetime.
Through OpenPBTA, we present a comprehensive, collaborative, open genomic analysis of 1,074 tumors and 22 cell lines, comprised of 58 distinct brain tumor histologies from 943 patients.
The data and containerized infrastructure of OpenPBTA have already supported discovery and translational research studies9–12, are actively integrated into PNOC molecular tumor board decision-making, and have provided a foundational layer for the Childhood Cancer Data Initiative’s (CCDI) recently-established pediatric Molecular Targets Platform (https://moleculartargets.ccdi.cancer.gov/).
We anticipate OpenPBTA will continue to be invaluable to the pediatric oncology community.
Results
Crowd-sourced Somatic Analyses to Create an Open Pediatric Brain Tumor Atlas
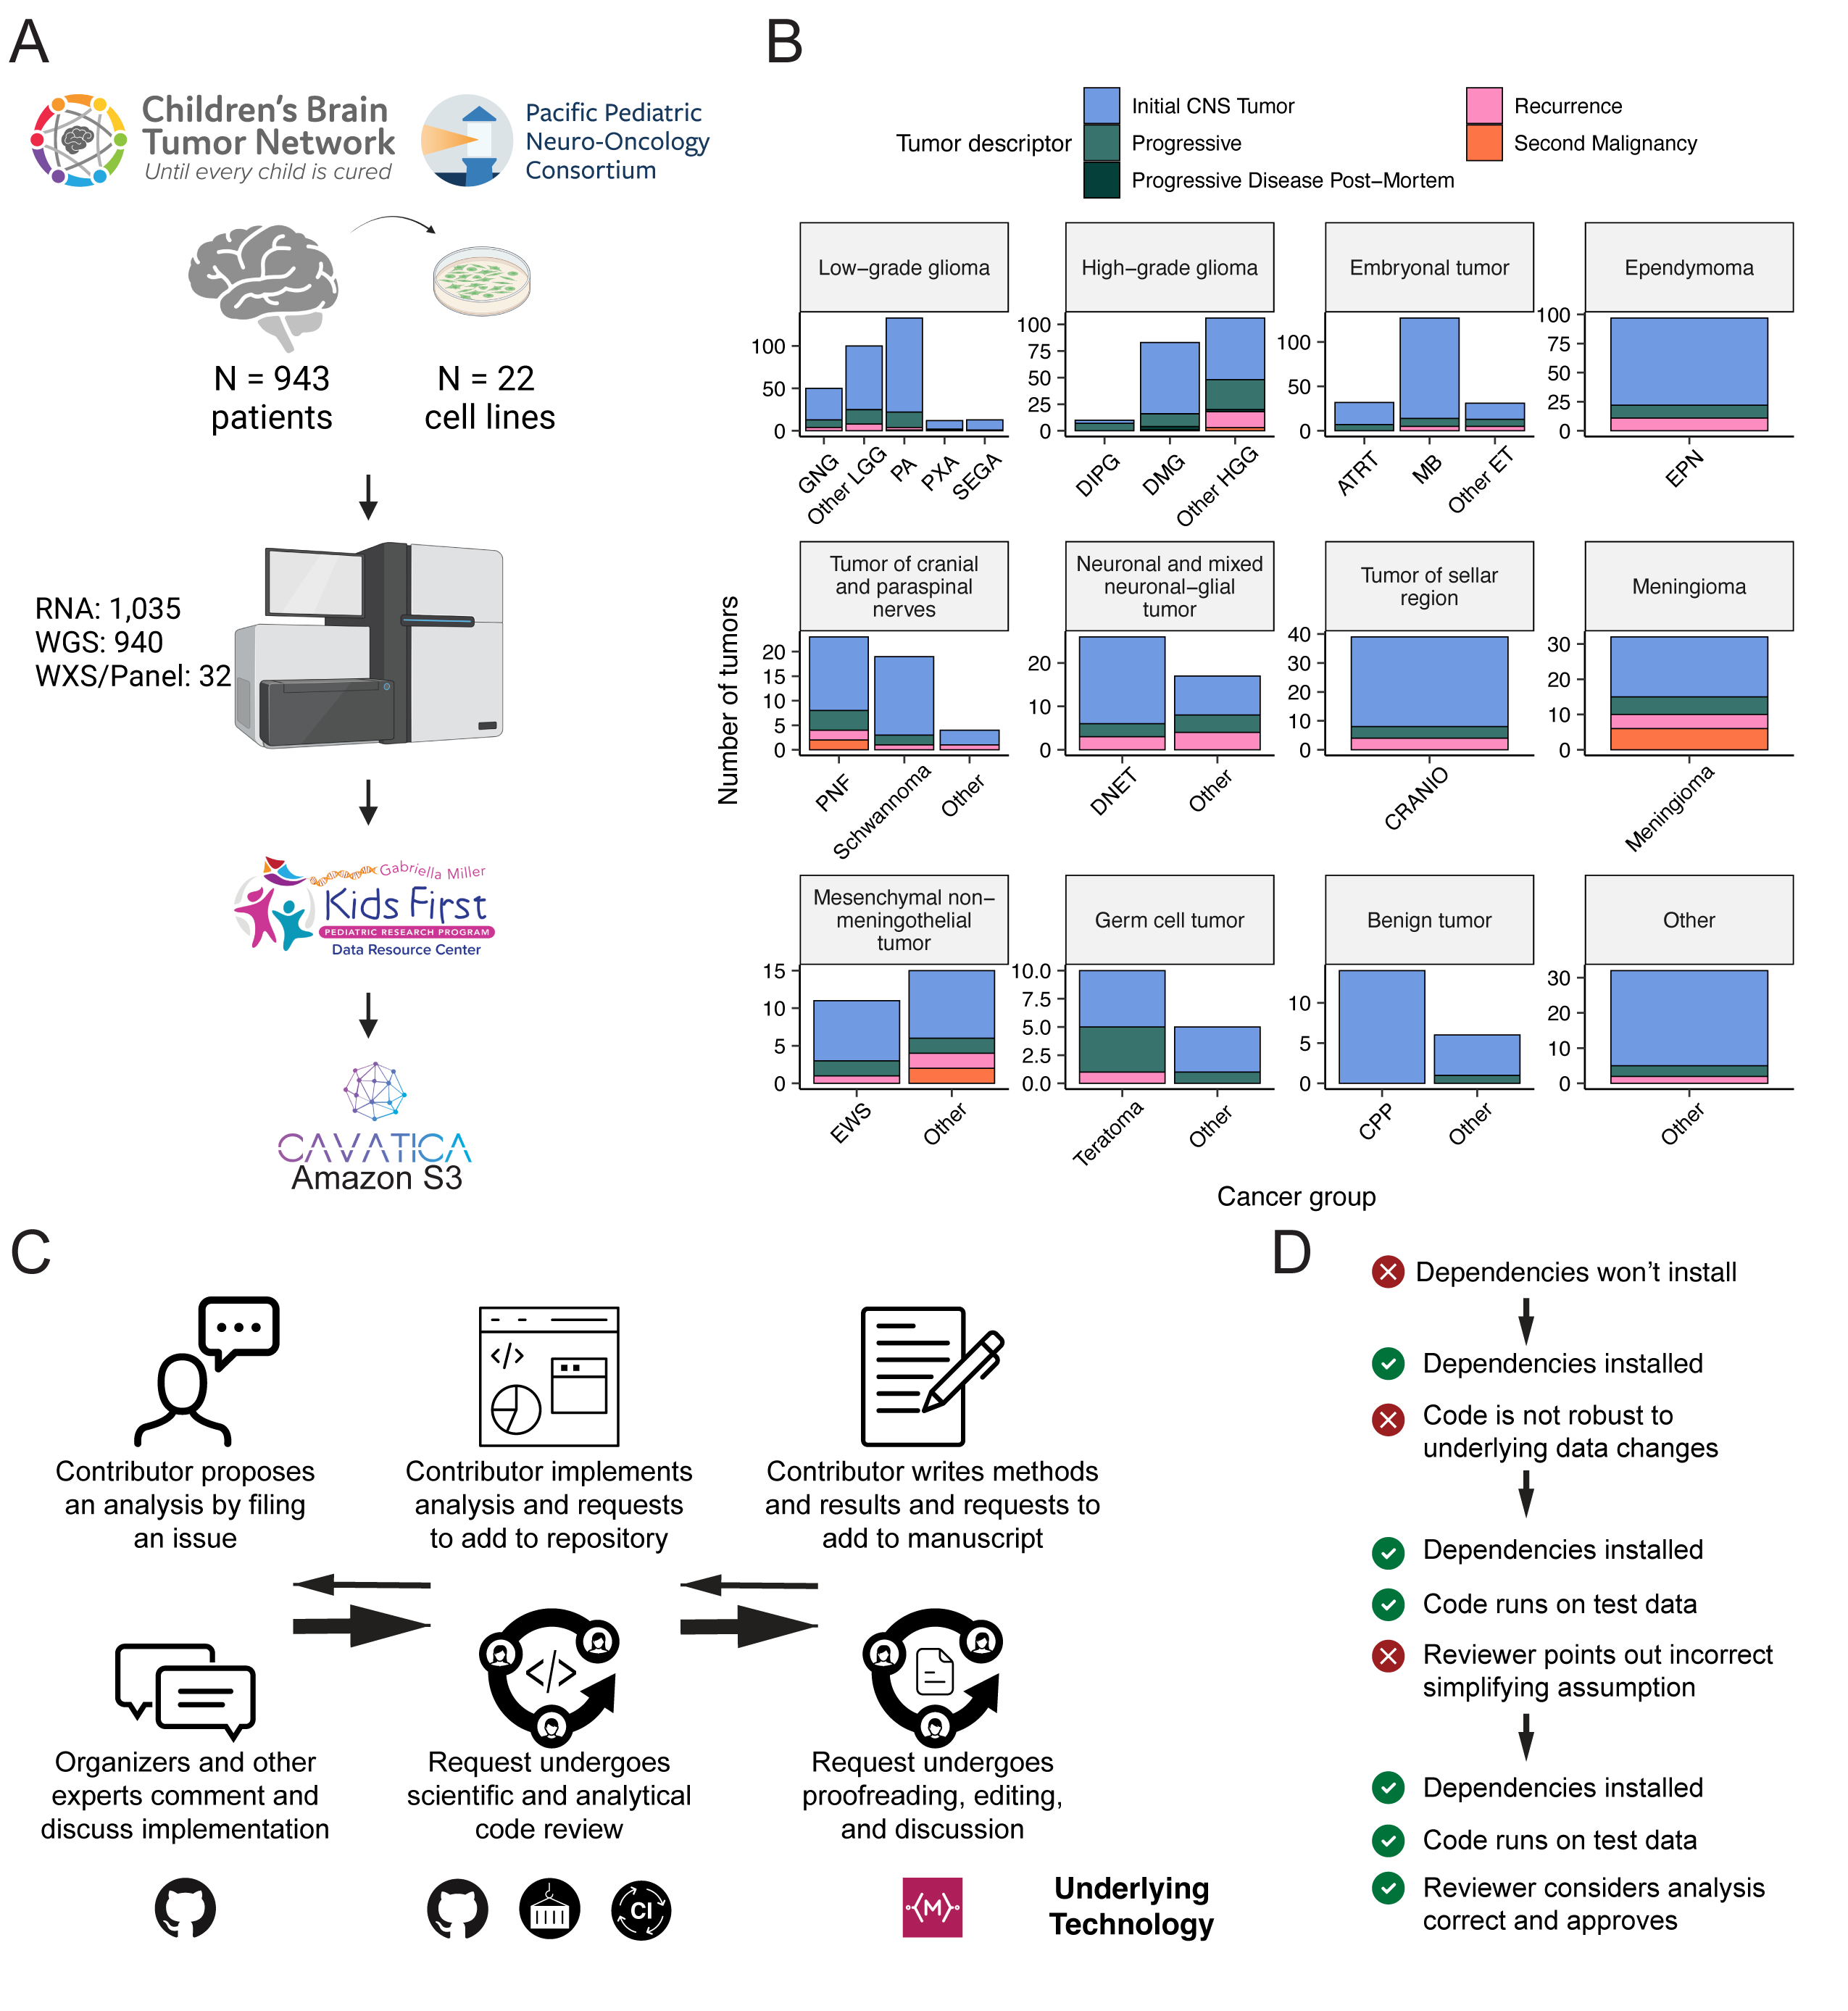
We previously performed whole genome sequencing (WGS), whole exome sequencing (WXS), and RNA sequencing (RNA-Seq) on matched tumor/normal tissues and selected cell lines13 from 943 patients from the Pediatric Brain Tumor Atlas (PBTA), consisting of 911 patients from the CBTN4 and 32 patients from PNOC10,14 (Figure 1A) across various histologies phrases of therapy (Figure 1B).
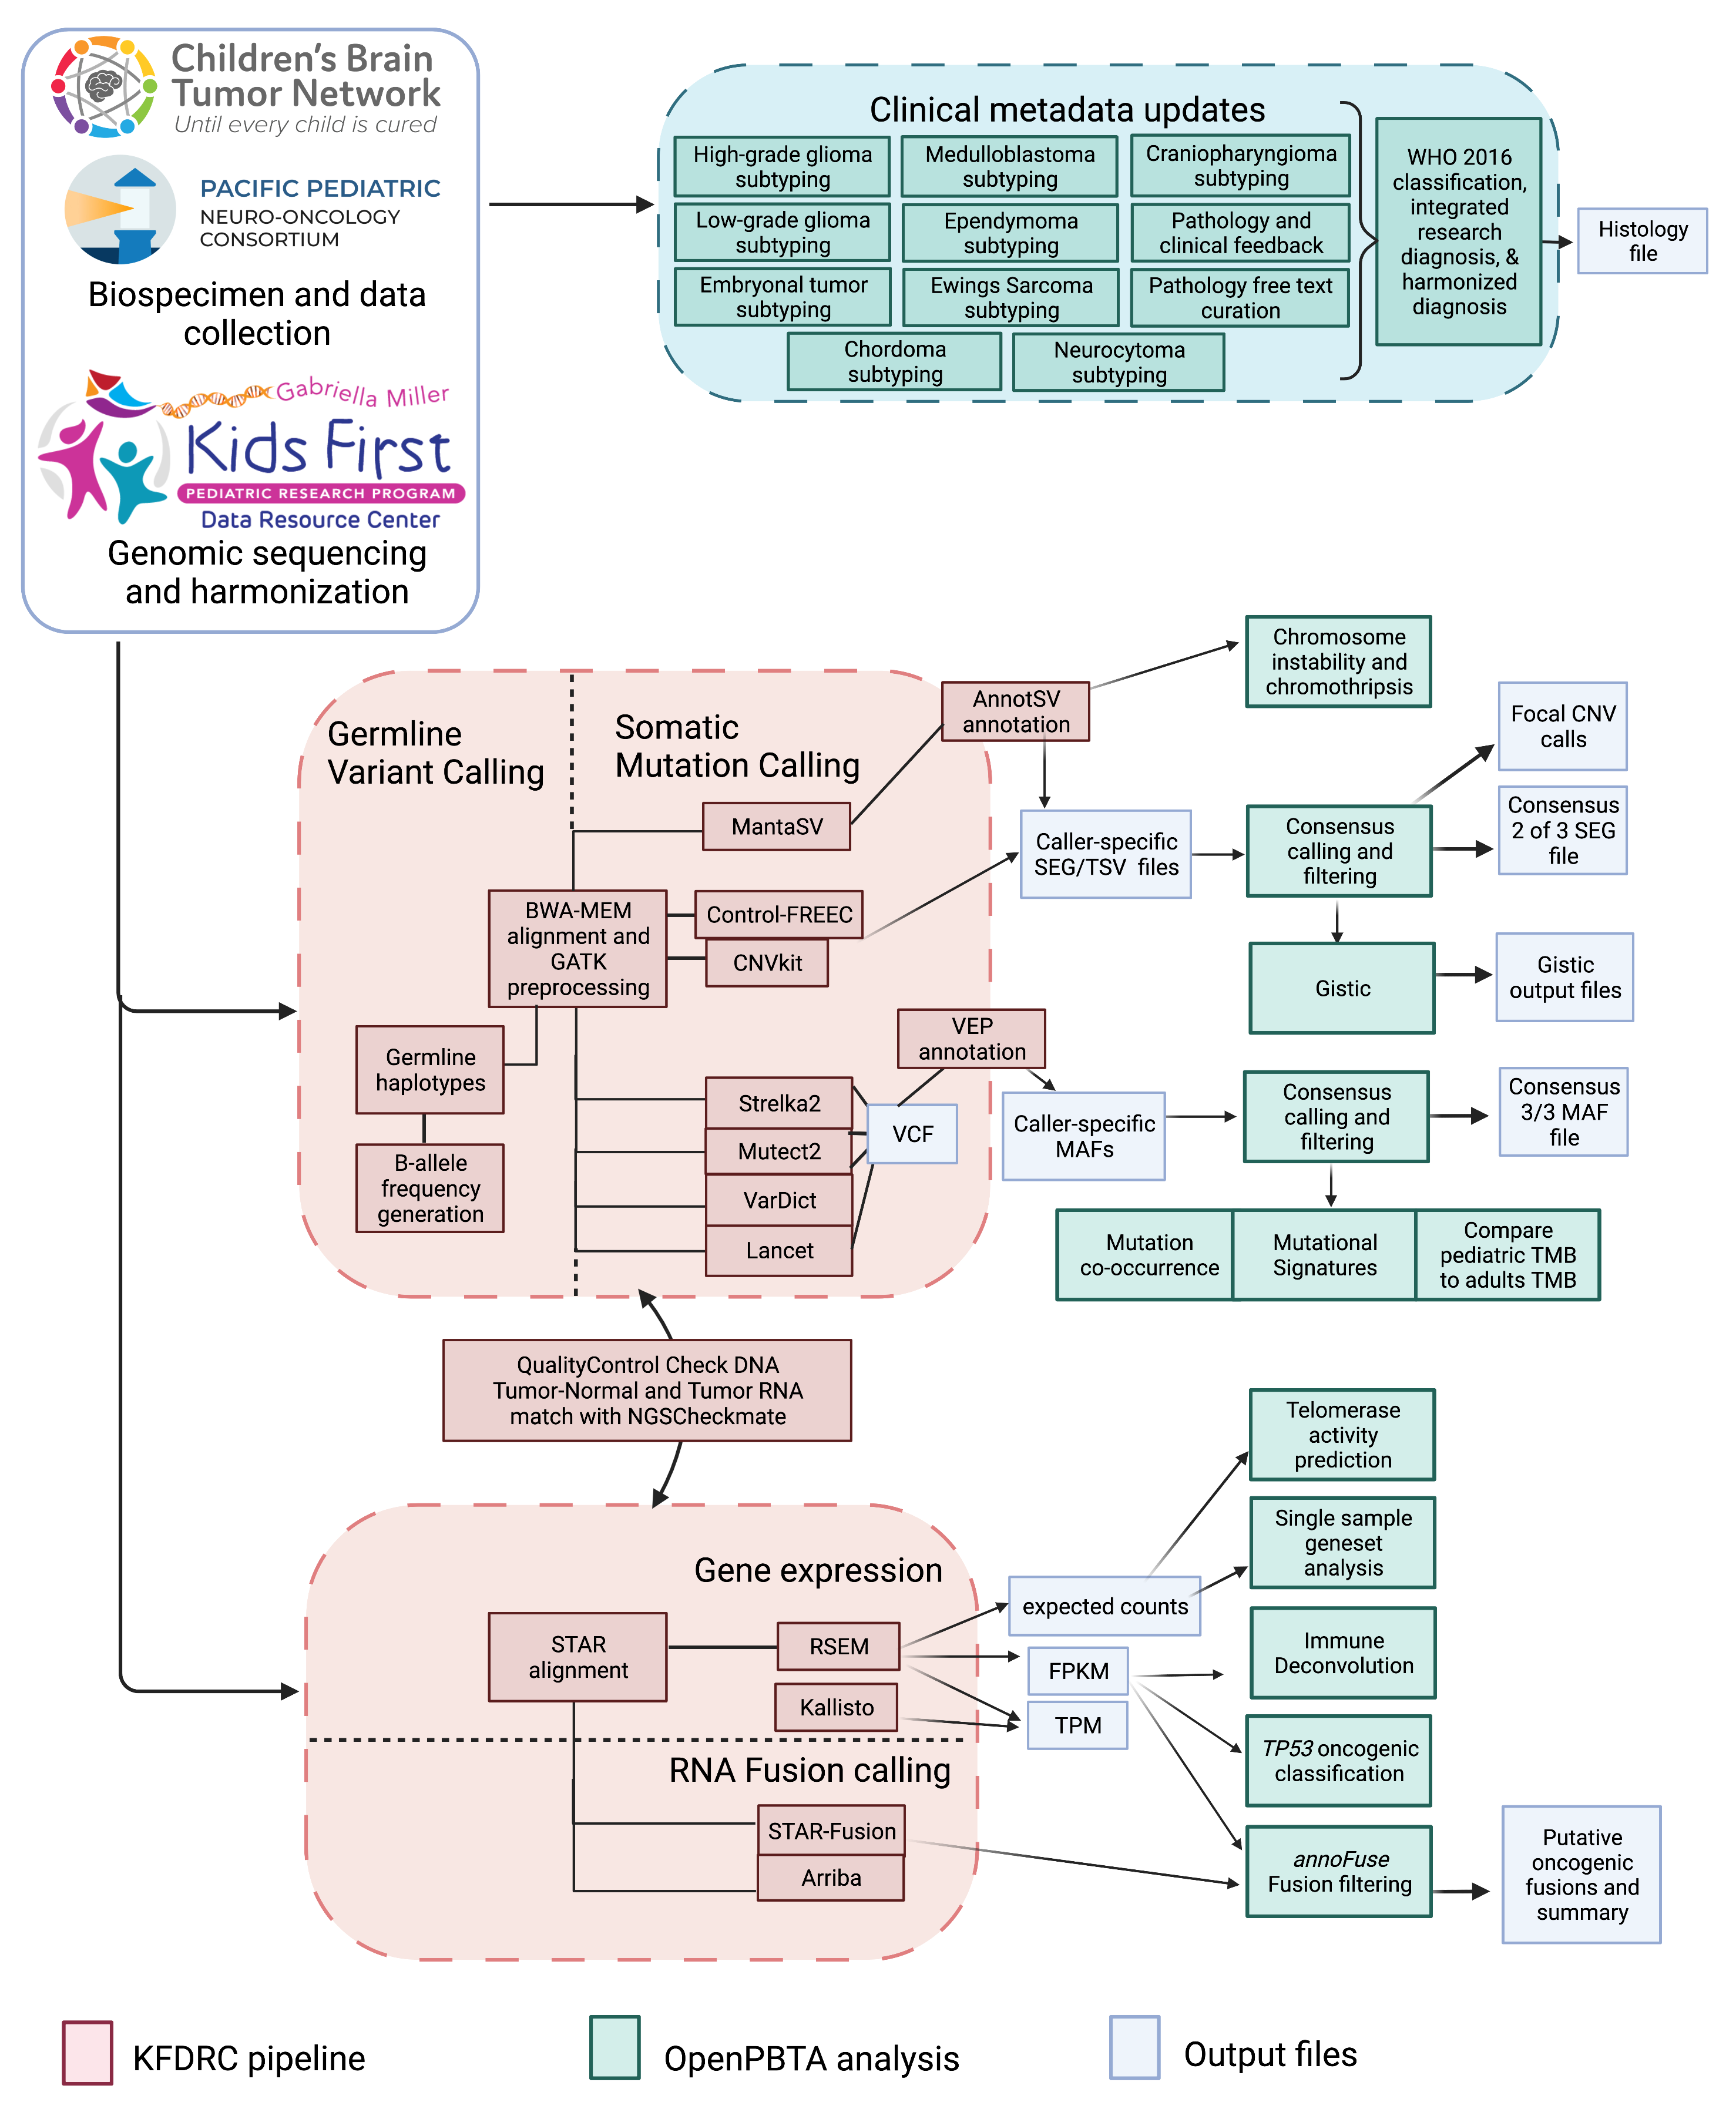
We harnessed and extended the benchmarking efforts of the Gabriella Miller Kids First Data Resource Center to develop robust and reproducible data analysis workflows within the CAVATICA platform for comprehensive somatic analyses (Figure S1) and STAR Methods) of the PBTA.
A key innovative feature of OpenPBTA is its open contribution framework used for analytical code and manuscript writing.
We created a public Github analysis repository (https://github.com/AlexsLemonade/OpenPBTA-analysis) to hold all analysis code downstream of Kids First workflows and a GitHub manuscript repository (https://github.com/AlexsLemonade/OpenPBTA-manuscript) with Manubot15 integration to enable real-time manuscript creation.
As all analyses and manuscript writing were conducted in public repositories, any researcher in the world could contribute to OpenPBTA following the process outlined in Figure 1C.
First, a potential contributor proposed an analysis by filing an issue in the GitHub analysis repository.
Next, project organizers or other contributors with expertise provided feedback about the proposed analysis (Figure 1C).
The contributor formally requested to include their analytical code and results – written in their own copy (fork) of repository – in the OpenPBTA analysis repository by filing a GitHub pull request (PR).
All PRs underwent peer review to ensure scientific accuracy, maintainability, and readability of code and documentation (Figure 1C-D).
Beyond peer review, we implemented additional checks to ensure consistent results for all collaborators over time (Figure 1D).
To provide a consistent software development environment, we created a monolithic image with all OpenPBTA dependencies using Docker®16 and the Rocker project17.
We used the continuous integration (CI) service CircleCI® to run analytical code in PRs on a test dataset before formal code review, allowing us to detect code bugs or sensitivity to data release changes.
We followed a similar process in our Manubot-powered15 repository for proposed manuscript additions (Figure 1C); peer reviewers ensured clarity and scientific accuracy, and Manubot performed spell-checking.
Figure 1:Overview of the OpenPBTA Project. A, CBTN and PNOC collected tumors from 943 patients. 22 tumor cell lines were created, and over 2000 specimens were sequenced (N = 1035 RNA-Seq, N = 940 WGS, and N = 32 WXS or targeted panel). The Kids First Data Resource Center Data harmonized the data using Amazon S3 through CAVATICA. Panel created with BioRender.com. B, Number of biospecimens across phases of therapy, with one broad histology per panel. Each bar denotes a cancer group. (Abbreviations: GNG = ganglioglioma, Other LGG = other low-grade glioma, PA = pilocytic astrocytoma, PXA = pleomorphic xanthoastrocytoma, SEGA = subependymal giant cell astrocytoma, DIPG = diffuse intrinsic pontine glioma, DMG = diffuse midline glioma, Other HGG = other high-grade glioma, ATRT = atypical teratoid rhabdoid tumor, MB = medulloblastoma, Other ET = other embryonal tumor, EPN = ependymoma, PNF = plexiform neurofibroma, DNET = dysembryoplastic neuroepithelial tumor, CRANIO = craniopharyngioma, EWS = Ewing sarcoma, CPP = choroid plexus papilloma). C, Overview of the open analysis and manuscript contribution models. Contributors proposed analyses, implemented it in their fork, and filed a pull request (PR) with proposed changes. PRs underwent review for scientific rigor and accuracy. Container and continuous integration technologies ensured that all software dependencies were included and code was not sensitive to underlying data changes. Finally, a contributor filed a PR documenting their methods and results to the Manubot-powered manuscript repository for review. D, A potential path for an analytical PR. Arrows indicate revisions.
Molecular Subtyping of OpenPBTA CNS Tumors
Since 2000, neuro-oncology experts and the WHO have collaborated to iteratively redefine central nervous system (CNS) tumor classifications18,19.
In 201620, molecular subtypes driven by genetic alterations were integrated into these classifications.
Since CBTN specimen collection began in 2011, most tumors lacked molecular subtype information when tissue was collected.
Moreover, PBTA does not yet feature methylation arrays which are increasingly used to inform molecular subtyping and cancer diagnosis.
Therefore, we created analysis modules to systematically consider key genomic features of tumors described by the WHO in 2016 or Ryall and colleagues21.
Coupled with clinician and pathologist review, we generated high-confidence research-grade integrated diagnoses for 60% (644/1074) of tumors (Table S1) without methylation data, a major innovation of this project.
We then aligned OpenPBTA specimen diagnoses with WHO classifications (e.g., tumors formerly ascribed primitive neuro-ectodermal tumor [PNET] diagnoses), discovered rarer tumor entities (e.g., H3-mutant ependymoma, meningioma with YAP1::FAM118B fusion), as well as identified and corrected data entry errors (e.g., an embryonal tumor with multilayer rosettes (ETMR) incorrectly entered as a medulloblastoma) and histologically mis-identified specimens (e.g., Ewing sarcoma sample labeled as a craniopharyngioma).
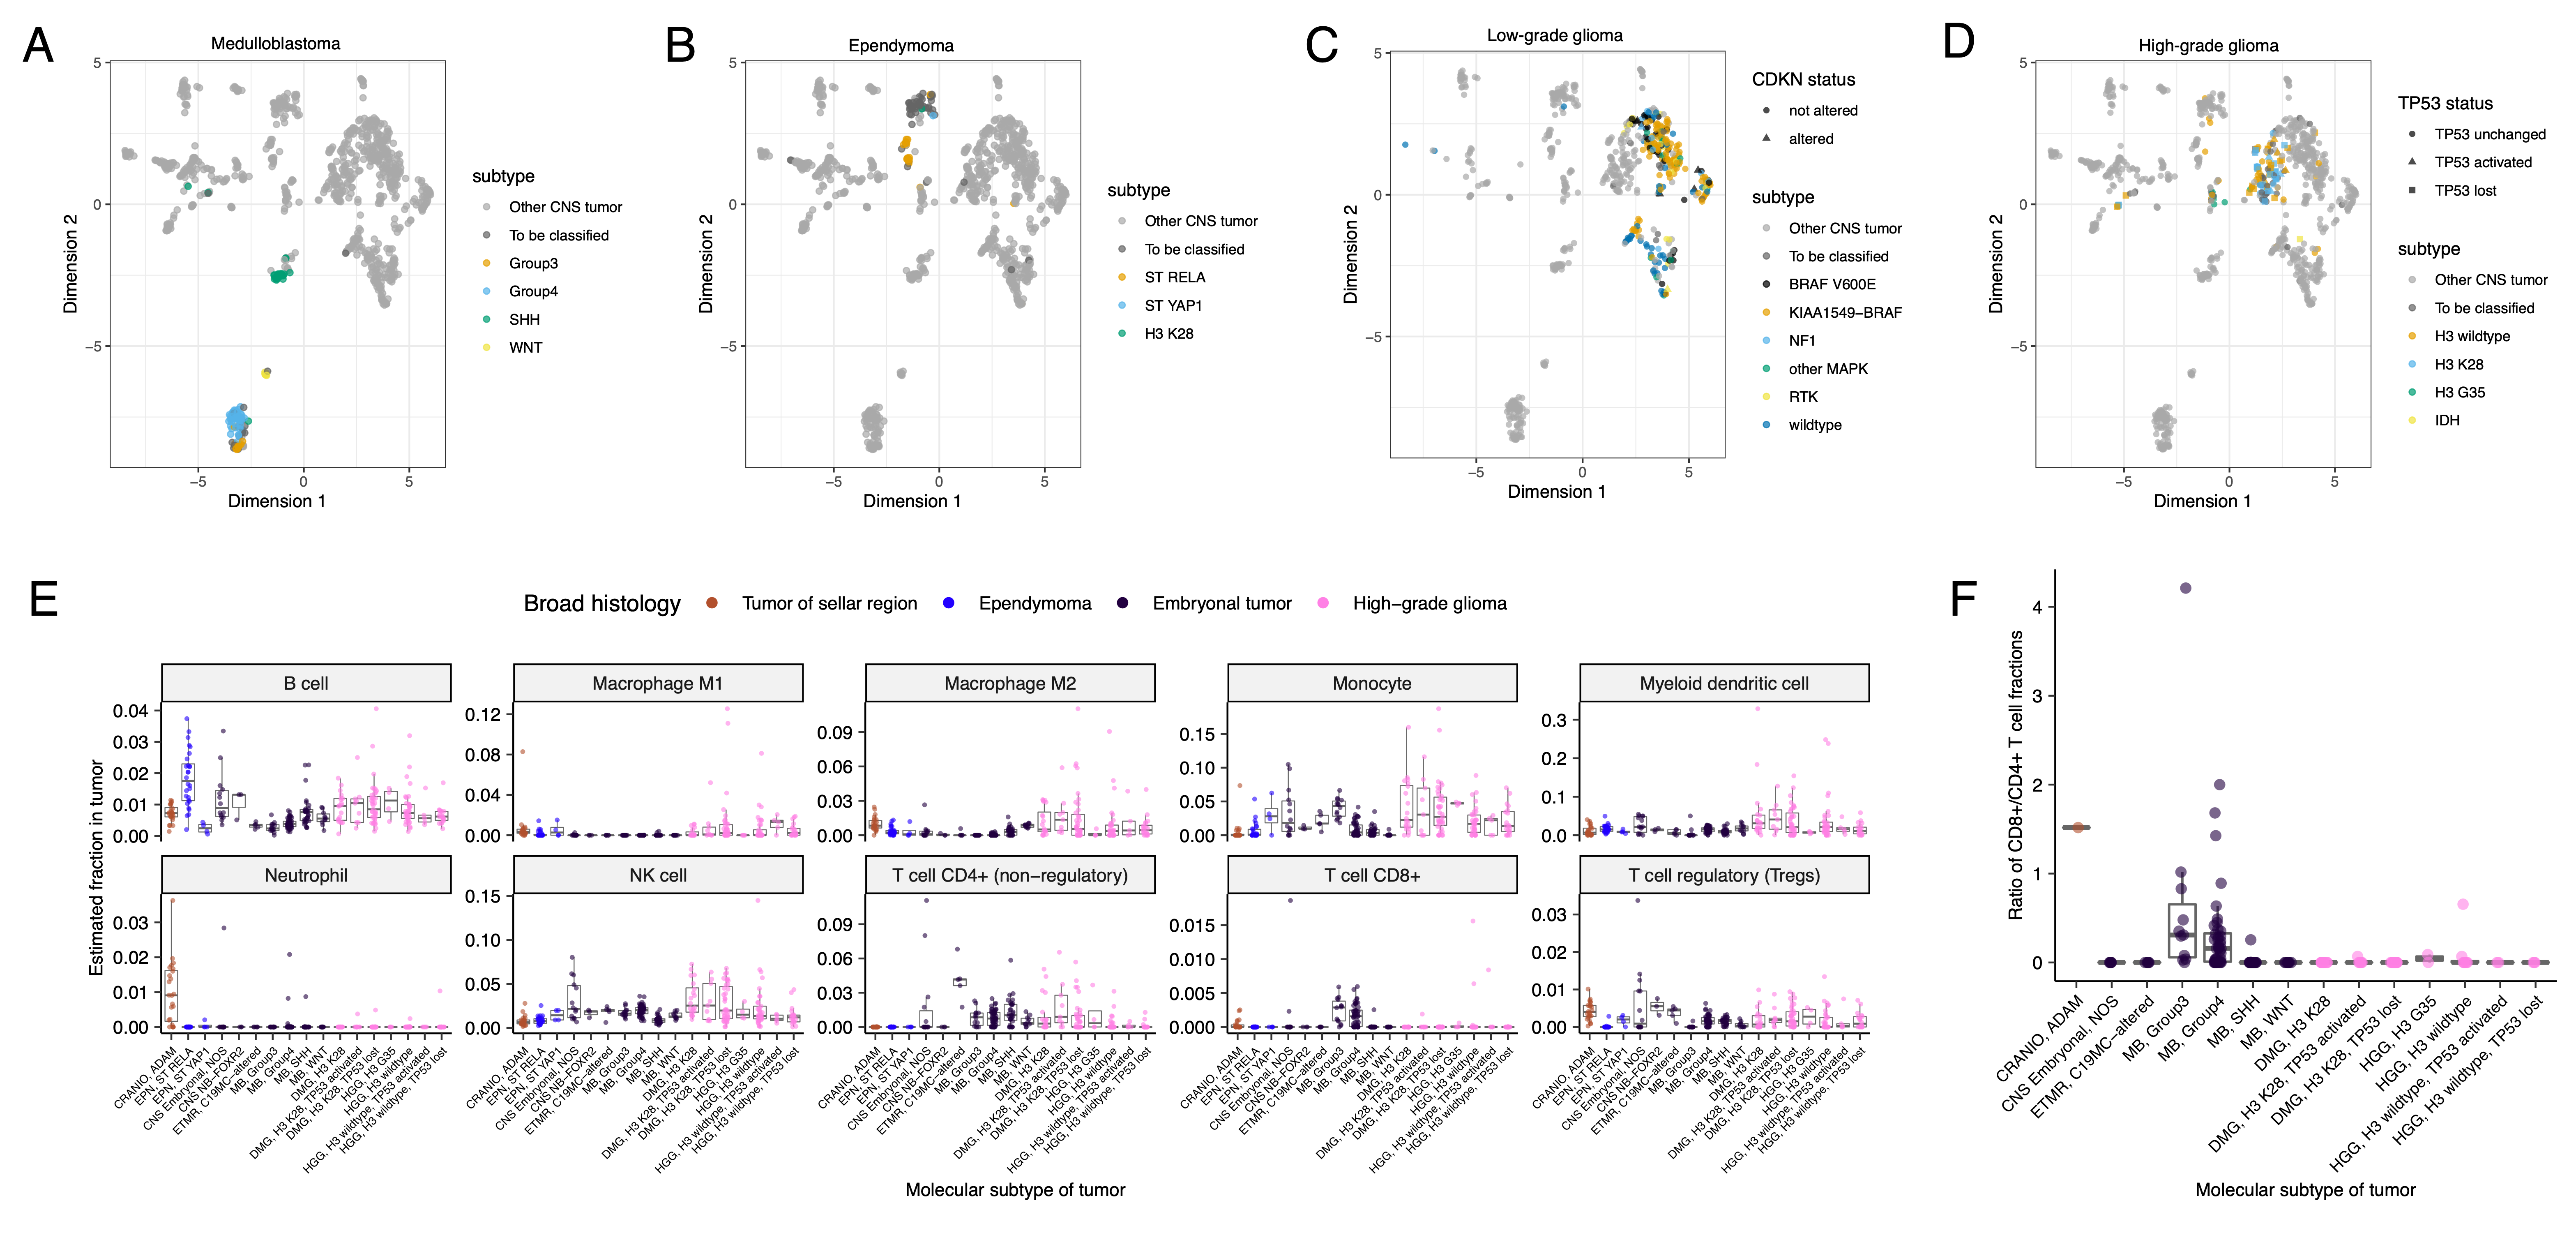
Uniquely, we used transcriptomic classification to subtype 122 medulloblastomas into SHH, WNT, Group 3, or Group 4 with MedulloClassifier22 and MM2S23, with 95% (41/43) and 91% (39/43) accuracy, respectively.
In total, we subtyped low-grade gliomas (LGGs) (N = 290), HGGs (N = 141), embryonal tumors (N = 126), ependymomas (N = 33), tumors of sellar region (N = 27), mesenchymal non-meningothelial tumors (N = 11), glialneuronal tumors (N = 10), and chordomas (N = 6), where Ns represent unique tumors (Table 1).
For detailed methods, see STAR Methods and Figure S1.
Table 1:Molecular subtypes generated through the OpenPBTA project. Broad tumor histologies, molecular subtypes generated, and number of patients and tumors subtyped within OpenPBTA.
Broad histology group
OpenPBTA molecular subtype
Patients
Tumors
Chordoma
CHDM, conventional
2
2
Chordoma
CHDM, poorly differentiated
2
4
Embryonal tumor
CNS Embryonal, NOS
13
13
Embryonal tumor
CNS HGNET-MN1
1
1
Embryonal tumor
CNS NB-FOXR2
2
3
Embryonal tumor
ETMR, C19MC-altered
5
5
Embryonal tumor
ETMR, NOS
1
1
Embryonal tumor
MB, Group3
14
14
Embryonal tumor
MB, Group4
48
49
Embryonal tumor
MB, SHH
24
30
Embryonal tumor
MB, WNT
10
10
Ependymoma
EPN, H3 K28
1
1
Ependymoma
EPN, ST RELA
25
28
Ependymoma
EPN, ST YAP1
3
4
High-grade glioma
DMG, H3 K28
18
24
High-grade glioma
DMG, H3 K28, TP53 activated
10
13
High-grade glioma
DMG, H3 K28, TP53 loss
30
40
High-grade glioma
HGG, H3 G35
3
3
High-grade glioma
HGG, H3 G35, TP53 loss
1
1
High-grade glioma
HGG, H3 wildtype
26
31
High-grade glioma
HGG, H3 wildtype, TP53 activated
5
5
High-grade glioma
HGG, H3 wildtype, TP53 loss
14
21
High-grade glioma
HGG, IDH, TP53 activated
1
2
High-grade glioma
HGG, IDH, TP53 loss
1
1
Low-grade glioma
GNG, BRAF V600E
13
13
Low-grade glioma
GNG, BRAF V600E, CDKN2A/B
1
1
Low-grade glioma
GNG, FGFR
1
1
Low-grade glioma
GNG, H3
1
1
Low-grade glioma
GNG, IDH
1
2
Low-grade glioma
GNG, KIAA1549-BRAF
5
5
Low-grade glioma
GNG, MYB/MYBL1
1
1
Low-grade glioma
GNG, NF1-germline
1
1
Low-grade glioma
GNG, NF1-somatic, BRAF V600E
1
1
Low-grade glioma
GNG, other MAPK
4
4
Low-grade glioma
GNG, other MAPK, IDH
1
1
Low-grade glioma
GNG, RTK
2
3
Low-grade glioma
GNG, wildtype
14
14
Low-grade glioma
LGG, BRAF V600E
25
27
Low-grade glioma
LGG, BRAF V600E, CDKN2A/B
5
5
Low-grade glioma
LGG, FGFR
8
8
Low-grade glioma
LGG, IDH
3
3
Low-grade glioma
LGG, KIAA1549-BRAF
106
113
Low-grade glioma
LGG, KIAA1549-BRAF, NF1-germline
1
1
Low-grade glioma
LGG, KIAA1549-BRAF, other MAPK
1
1
Low-grade glioma
LGG, MYB/MYBL1
2
2
Low-grade glioma
LGG, NF1-germline
6
6
Low-grade glioma
LGG, NF1-germline, CDKN2A/B
1
1
Low-grade glioma
LGG, NF1-germline, FGFR
1
2
Low-grade glioma
LGG, NF1-somatic
2
2
Low-grade glioma
LGG, NF1-somatic, FGFR
1
1
Low-grade glioma
LGG, NF1-somatic, NF1-germline, CDKN2A/B
1
1
Low-grade glioma
LGG, other MAPK
11
12
Low-grade glioma
LGG, RTK
8
10
Low-grade glioma
LGG, RTK, CDKN2A/B
1
1
Low-grade glioma
LGG, wildtype
33
34
Low-grade glioma
SEGA, RTK
1
1
Low-grade glioma
SEGA, wildtype
10
11
Mesenchymal non-meningothelial tumor
EWS
9
11
Neuronal and mixed neuronal-glial tumor
CNC
2
2
Neuronal and mixed neuronal-glial tumor
EVN
1
1
Neuronal and mixed neuronal-glial tumor
GNT, BRAF V600E
1
1
Neuronal and mixed neuronal-glial tumor
GNT, KIAA1549-BRAF
1
2
Neuronal and mixed neuronal-glial tumor
GNT, other MAPK
1
1
Neuronal and mixed neuronal-glial tumor
GNT, other MAPK, FGFR
1
1
Neuronal and mixed neuronal-glial tumor
GNT, RTK
1
2
Tumor of sellar region
CRANIO, ADAM
27
27
Total
577
644
Somatic Mutational Landscape of Pediatric Brain Tumors
We performed a comprehensive genomic analysis of somatic SNVs, CNVs, SVs, and fusions across all 1,074 PBTA tumors (N = 1,019 RNA-Seq, N = 918 WGS, N = 32 WXS/Panel) and 22 cell lines (N = 16 RNA-Seq, N = 22 WGS), from 943 patients, 833 with paired normal specimens (N = 801 WGS, N = 32 WXS/Panel).
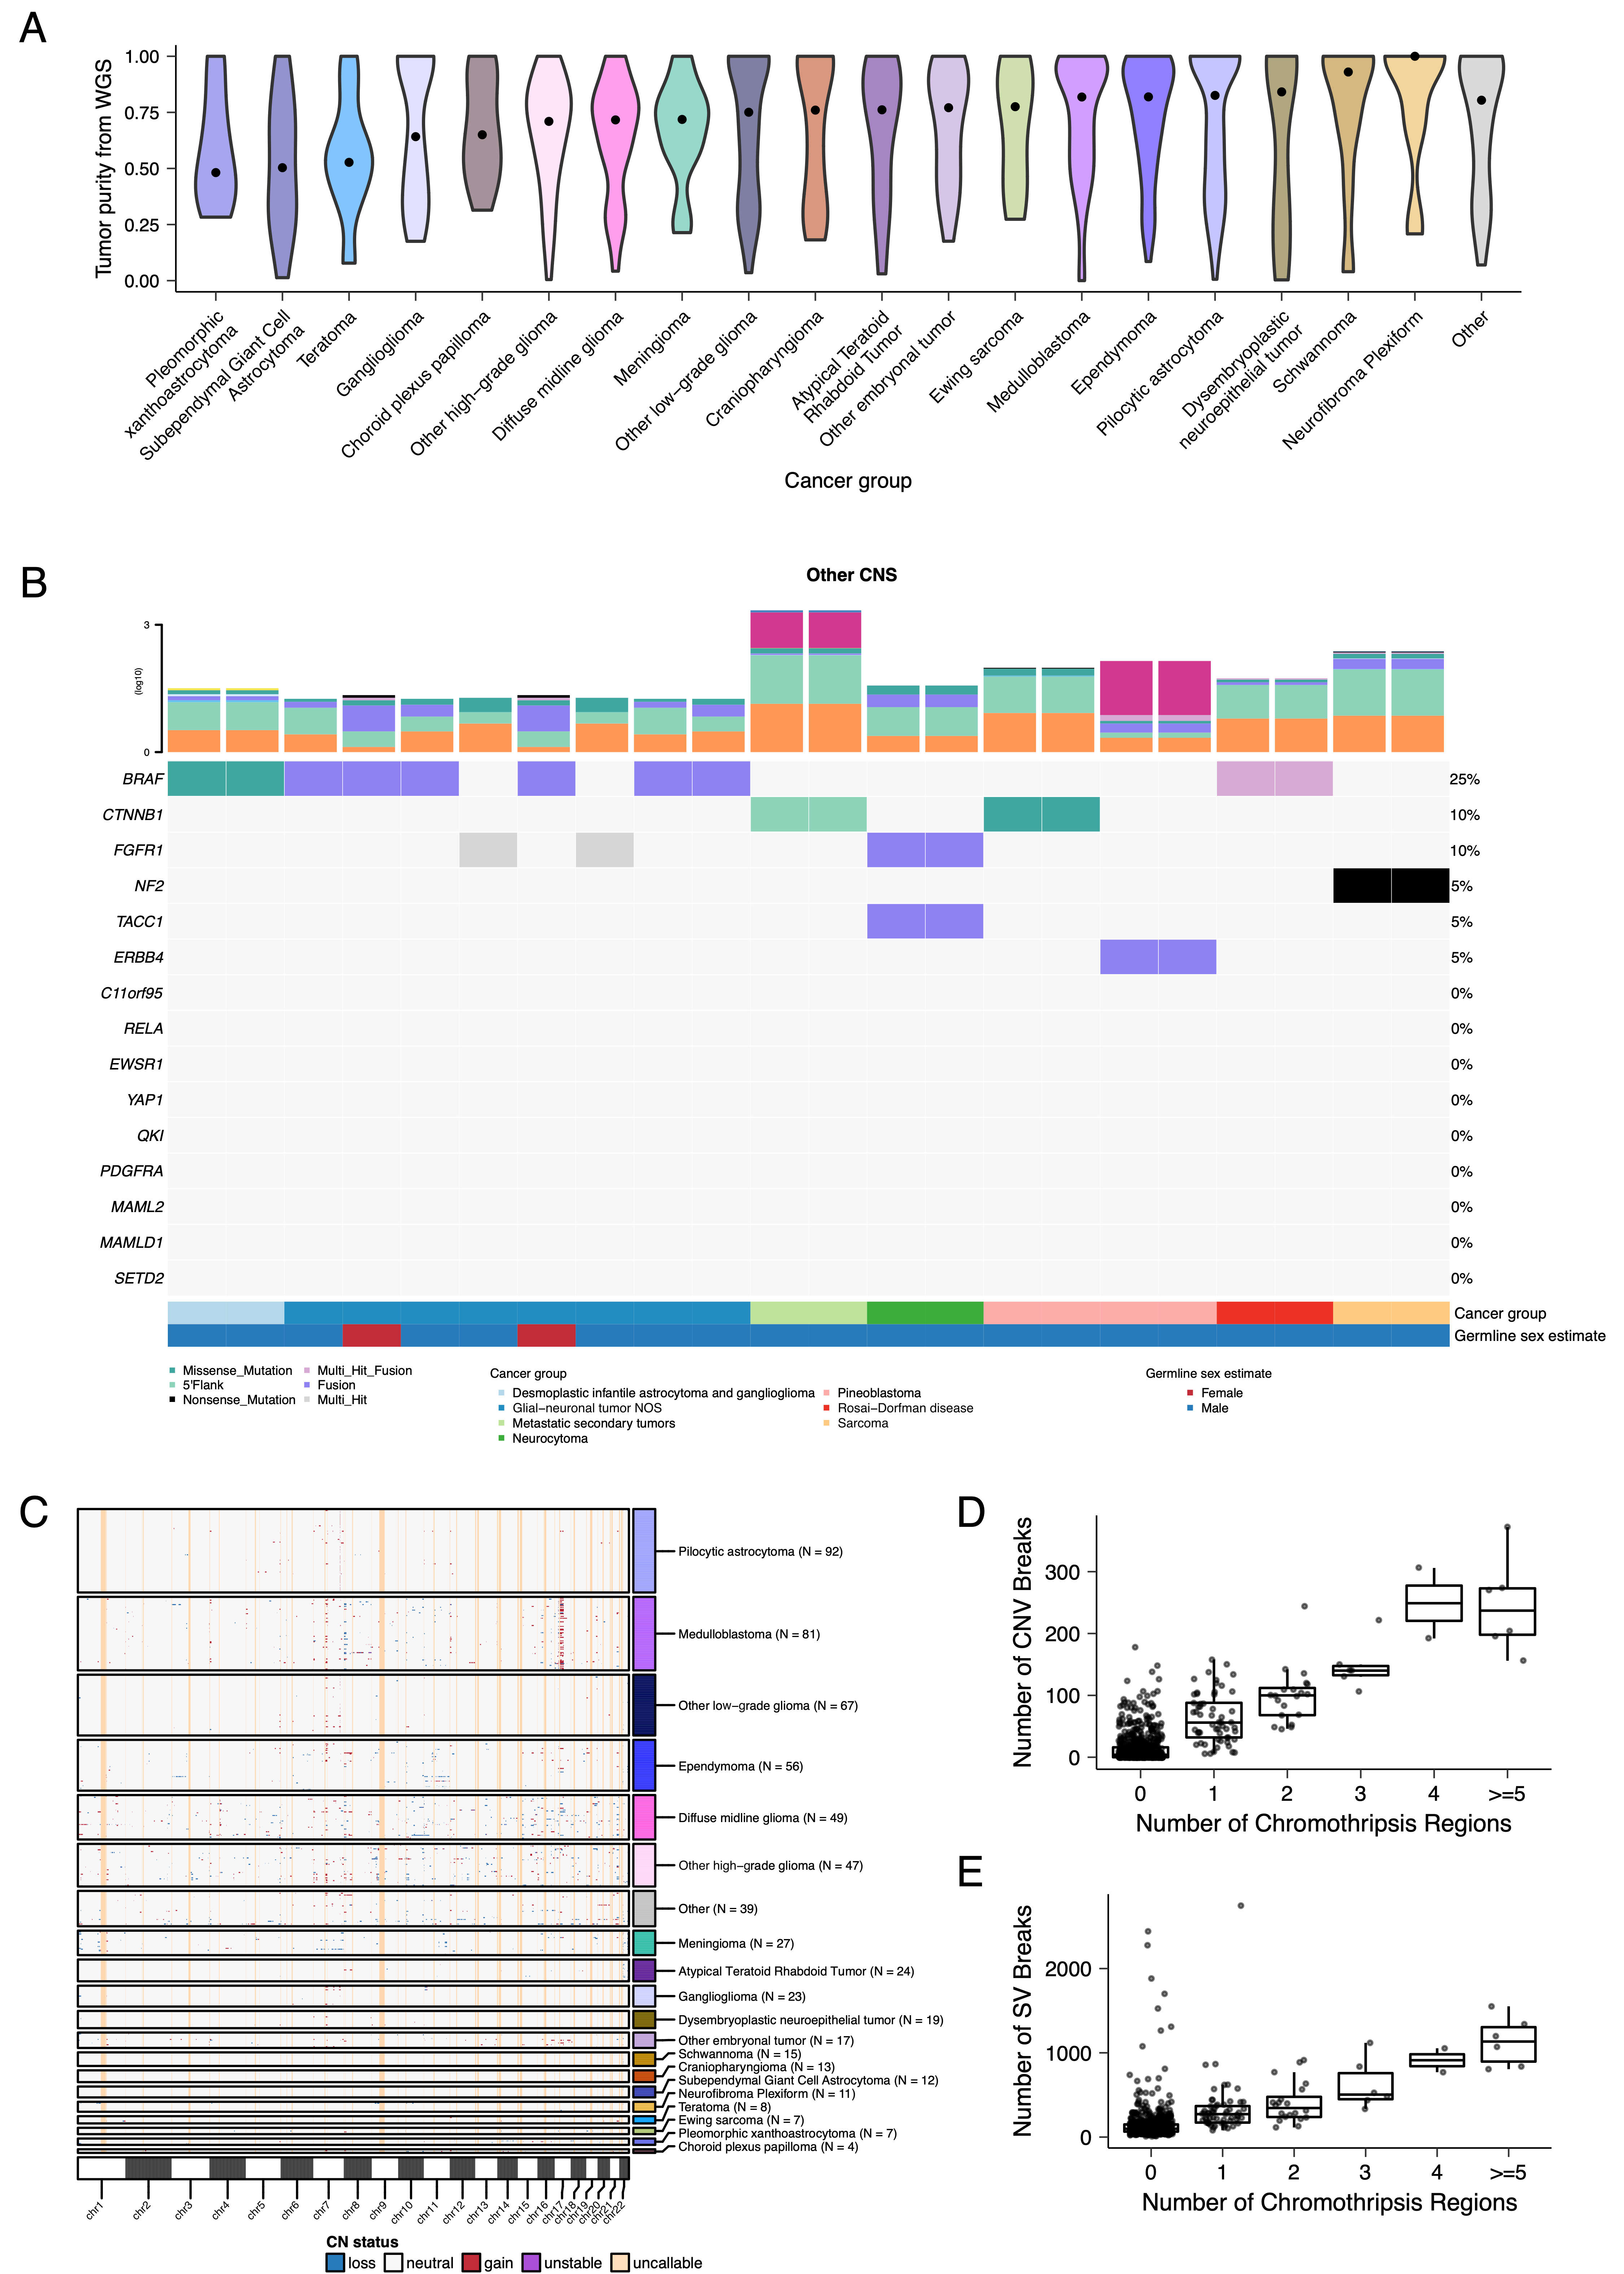
Tumor purity across PBTA samples was high (median 76%), though we observed some cancer groups with lower purity, including SEGA, PXA, and teratoma (Figure S3A).
Unless otherwise noted, each analysis was performed for diagnostic tumors using one tumor per patient.
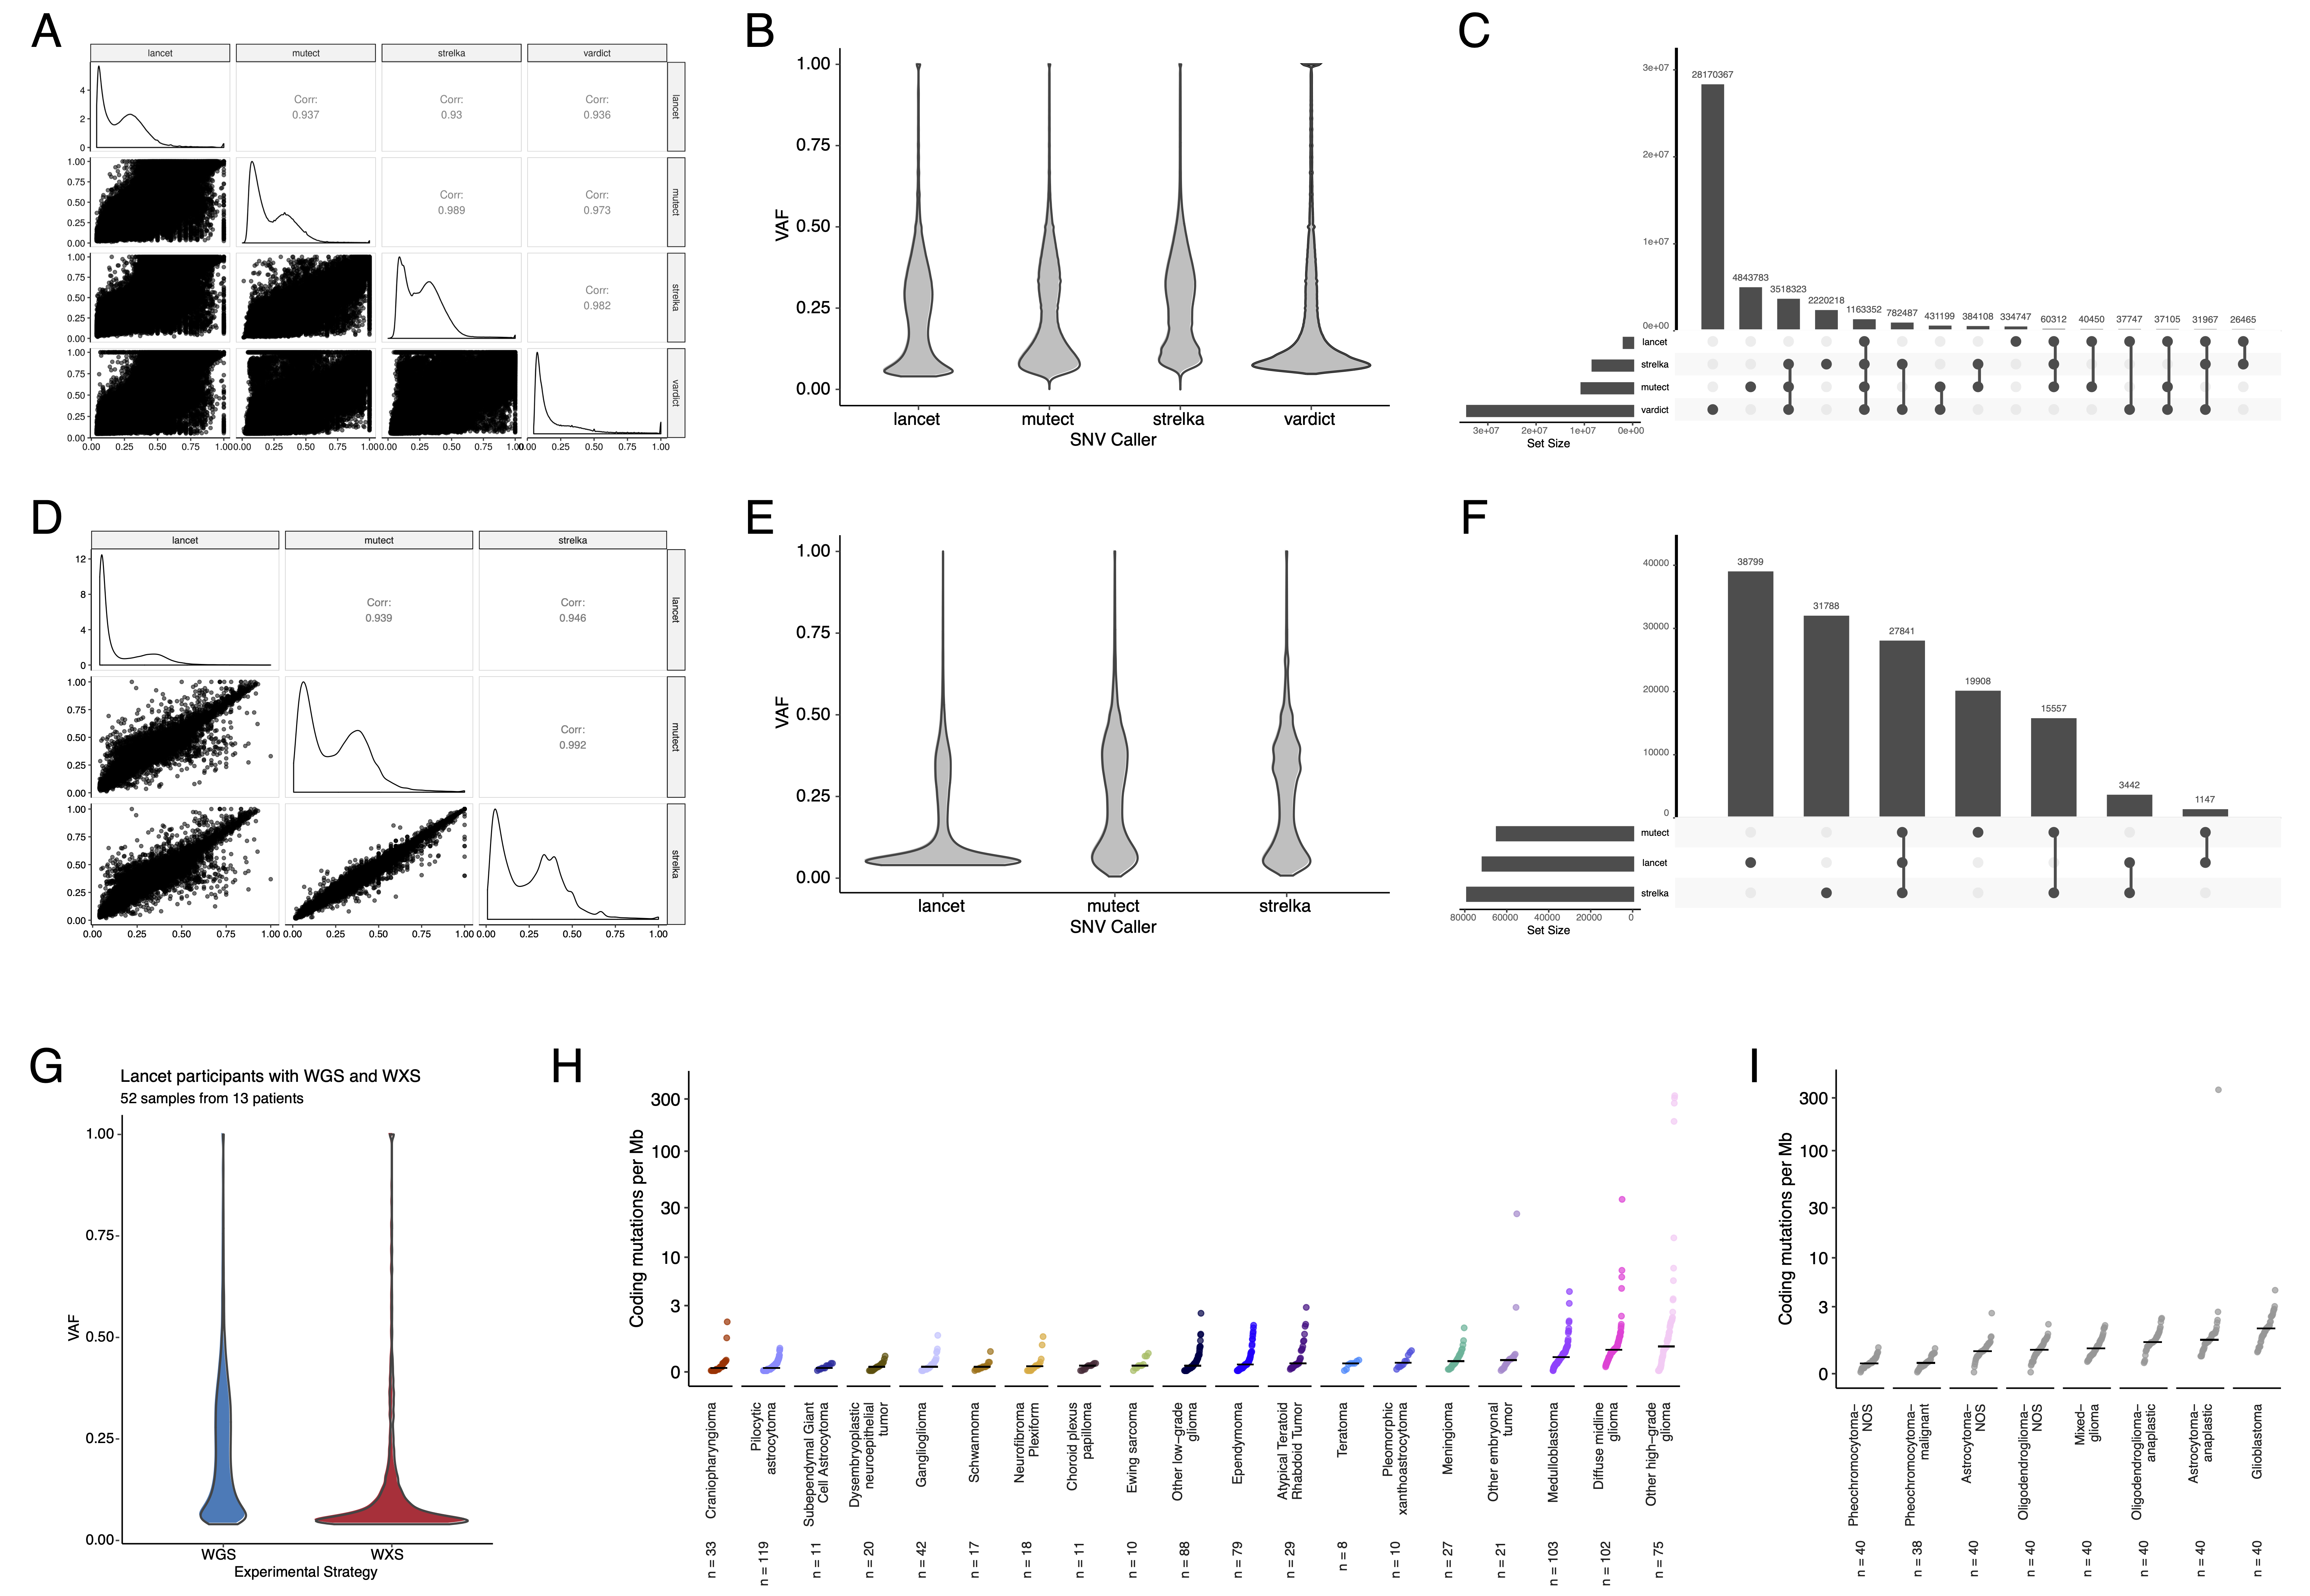
SNV consensus calling (Figure S1 and Figure S2A-G) revealed, as expected, lower tumor mutation burden (TMB) (Figure S2H) in pediatric tumors compared to adult brain tumors from The Cancer Genome Atlas (TCGA) (Figure S2I), with hypermutant (> 10 Mut/Mb) and ultra-hypermutant (> 100 Mut/Mb) tumors24 only found within HGGs and embryonal tumors.
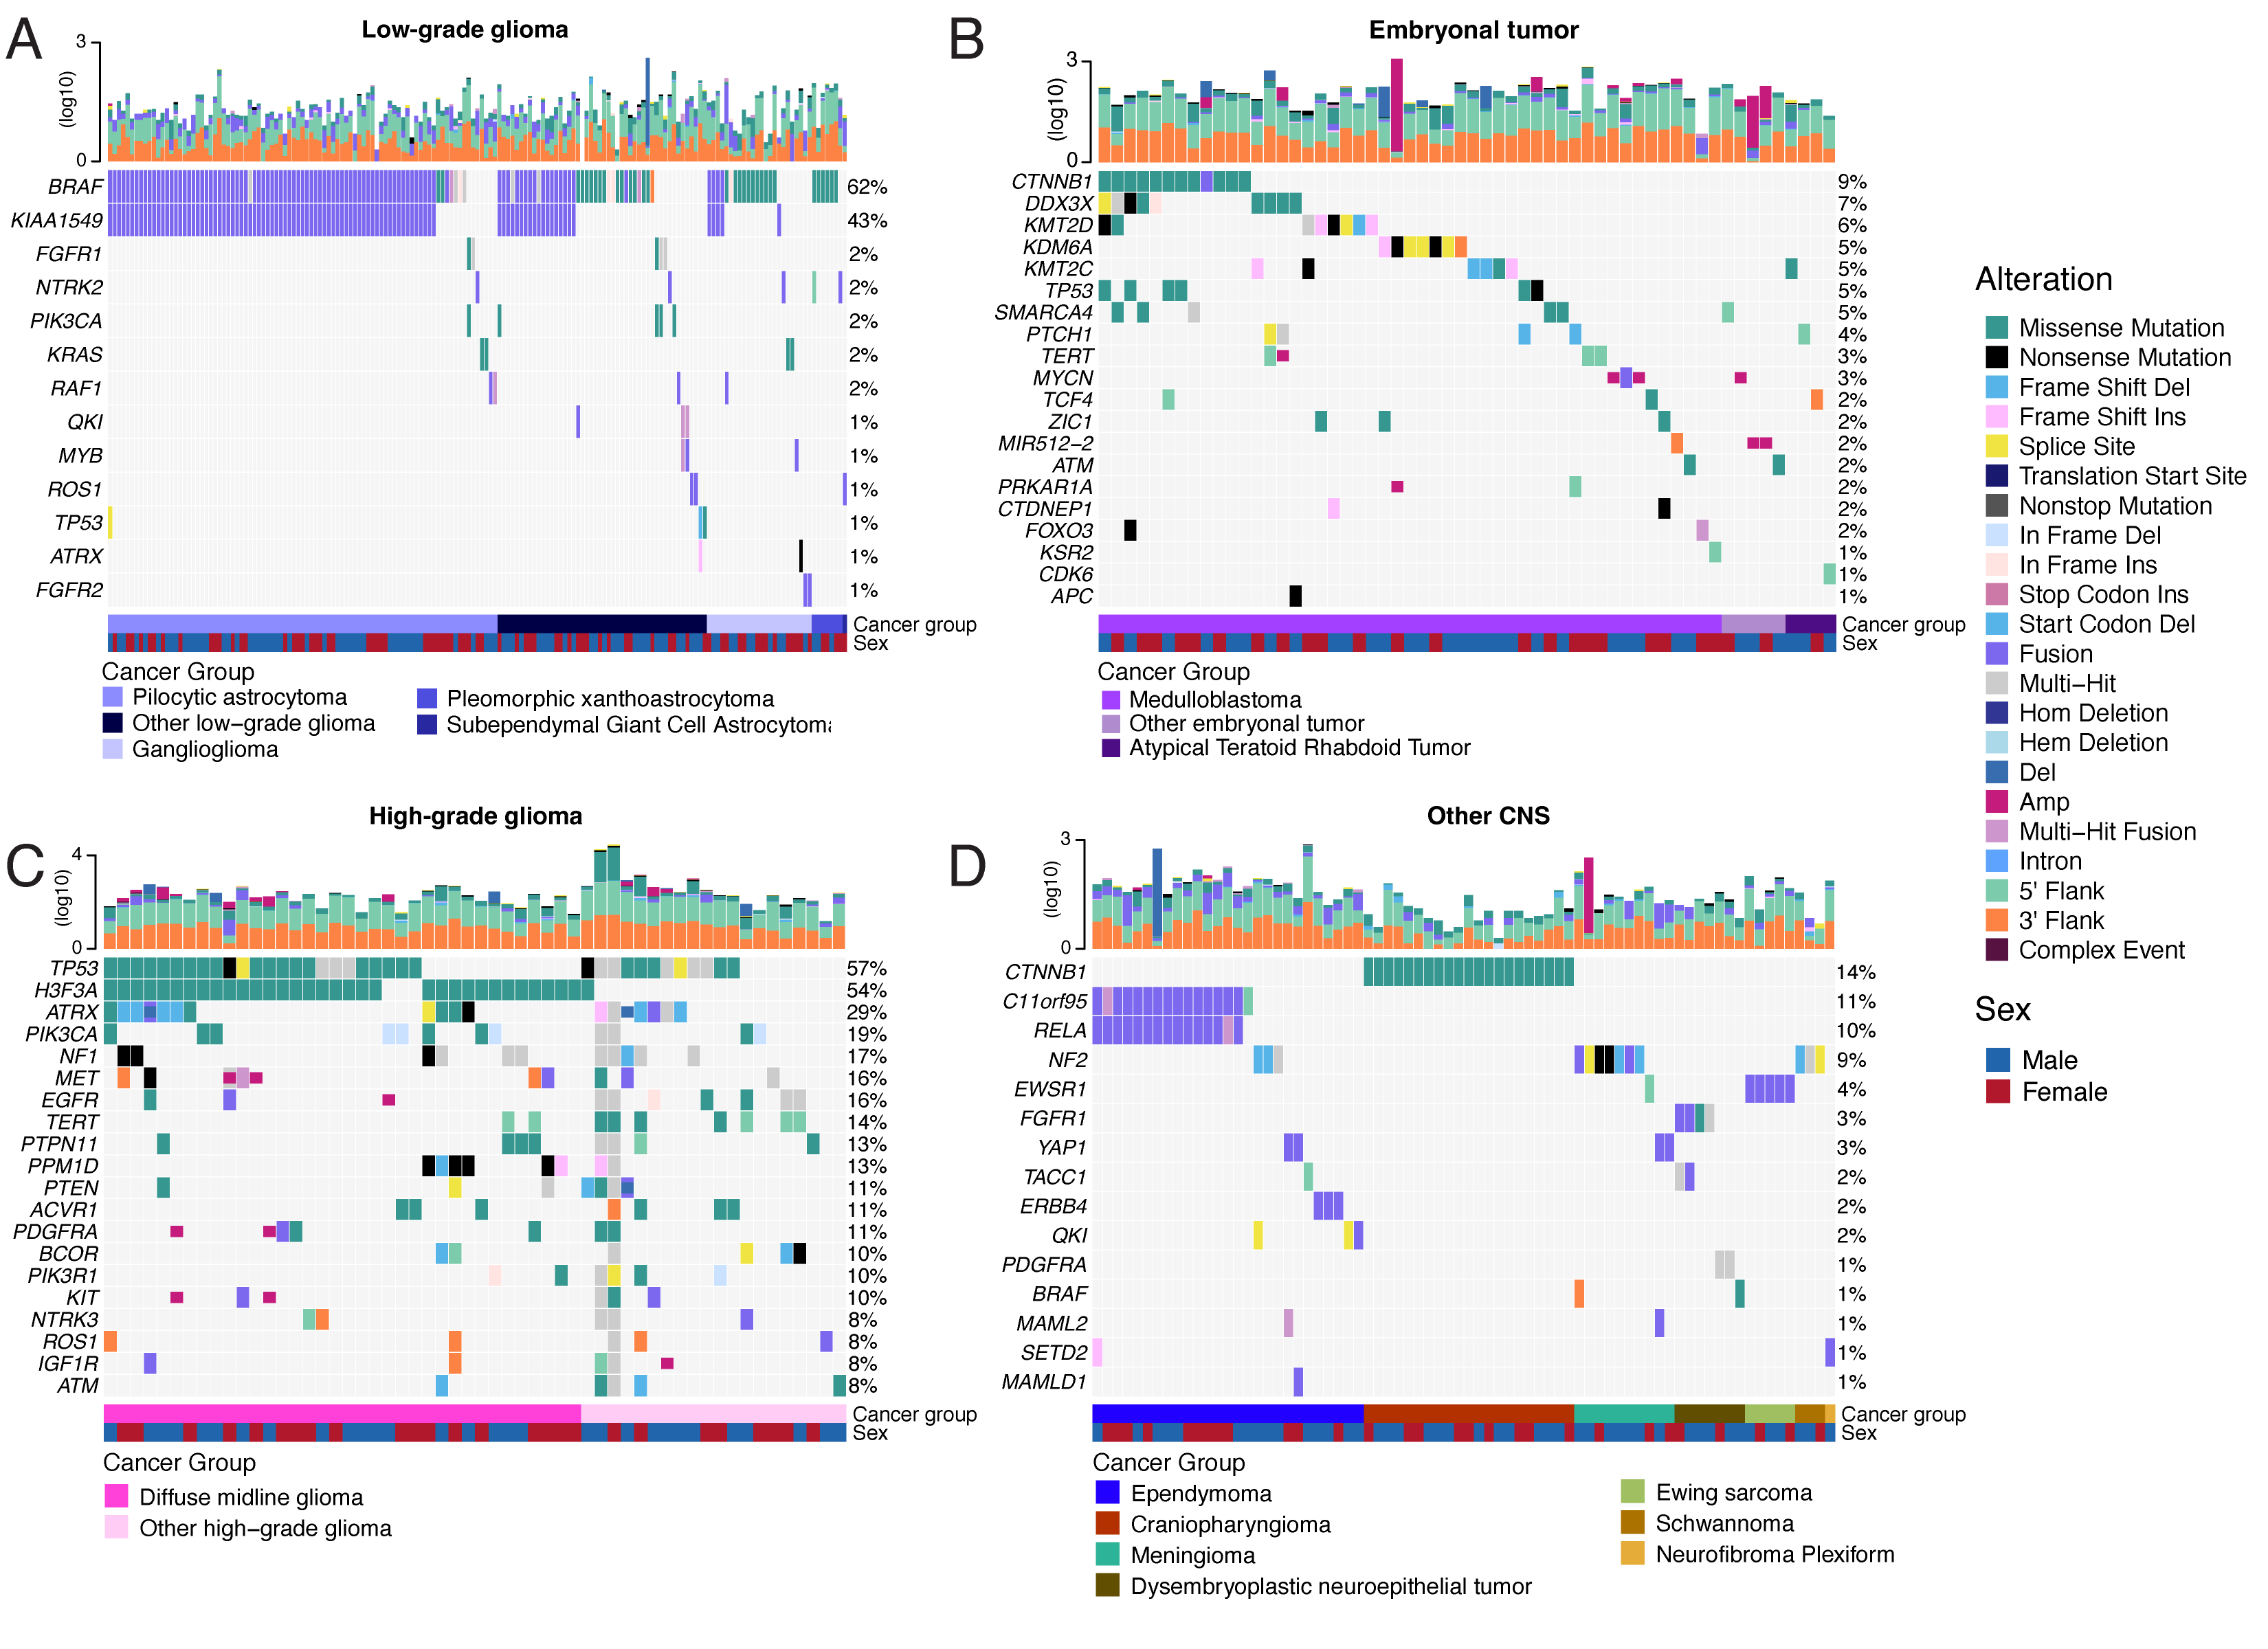
Figure 2 and Figure S3B depict oncoprints recapitulating known histology-specific driver genes in primary tumors across OpenPBTA histologies, and Table S2 summarizes all detected alterations across cancer groups.
Low-grade gliomas
As expected, most (62%, 140/226) LGGs harbored a somatic alteration in BRAF, with canonical BRAF::KIAA1549 fusions as the major oncogenic driver25 (Figure 2A).
We observed additional mutations in FGFR1 (2%), PIK3CA (2%), KRAS (2%), TP53 (1%), and ATRX (1%) and fusions in NTRK2 (2%), RAF1 (2%), MYB (1%), QKI (1%), ROS1 (1%), and FGFR2 (1%), concordant with previous studies reporting near-universal upregulation of the RAS/MAPK pathway in LGGs21,25.
Indeed, gene set variant analysis (GSVA) revealed significant upregulation (ANOVA Bonferroni-corrected p < 0.01) of the KRAS signaling pathway in LGGs (Figure 5B).
Embryonal tumors
Most (N = 95) embryonal tumors were medulloblastomas from four characterized molecular subtypes (WNT, SHH, Group3, and Group 4; see Molecular Subtyping of CNS Tumors), as identified by subtype-specific canonical mutations (Figure 2B).
We detected canonical SMARCB1/SMARCA4 deletions or inactivating mutations in atypical teratoid rhabdoid tumors (ATRTs; Table S2) and C19MC amplification in ETMRs (displayed within “Other embryonal tumors” in Figure 2B)26–29.
High-grade gliomas
Across HGGs, TP53 (57%, 36/63) and H3F3A (54%, 34/63) were both most mutated and co-occurring genes (Figure 2A and C), followed by frequent mutations in ATRX (29%, 18/63) which is commonly mutated in gliomas30.
We observed recurrent amplifications and fusions in EGFR, MET, PDGFRA, and KIT, highlighting that these tumors leverage multiple oncogenic mechanisms to activate tyrosine kinases, as previously reported14,31,32.
GSVA showed upregulation (ANOVA Bonferroni-corrected p < 0.01) of DNA repair, G2M checkpoint, and MYC pathways as well as downregulation of the TP53 pathway (Figure 5B).
The two ultra-hypermutated tumors (> 100 Mutations/Mb) were from patients with mismatch repair deficiency syndrome13.
Other CNS tumors
We observed that 25% (15/60) of ependymomas were C11orf95::RELA (now, ZFTA::RELA) fusion-positive33 and 68% (21/31) of craniopharyngiomas contained CTNNB1 mutations (Figure 2D).
We observed somatic mutations or fusions in NF2 in 41% (7/17) of meningiomas, 5% (3/60) of ependymomas, and 25% (3/12) of schwannomas, as well as rare fusions in ERBB4, YAP1, and/or QKI in 10% (6/60) of ependymomas.
DNETs harbored alterations in MAPK/PI3K pathway genes, as was previously reported34, including FGFR1 (21%, 4/19), PDGFRA (10%, 2/19), and BRAF (5%, 1/19).
Figure 2:Mutational landscape of PBTA tumors. Frequencies of canonical somatic gene mutations, CNVs, fusions, and TMB (top bar plot) for the top mutated genes across primary tumors within the OpenPBTA dataset. A, LGGs (N = 226): pilocytic astrocytoma (N = 104), other LGG (N = 68), ganglioglioma (N = 35), pleomorphic xanthoastrocytoma (N = 9), subependymal giant cell astrocytoma (N = 10). B, Embryonal tumors (N = 129): medulloblastoma (N = 95), atypical teratoid rhabdoid tumor (N = 24), other embryonal tumor (N = 10). C, HGGs (N = 63): diffuse midline glioma (N = 36) and other HGG (N = 27). D, Other CNS tumors (N = 153): ependymoma (N = 60), craniopharyngioma (N = 31), meningioma (N = 17), dysembryoplastic neuroepithelial tumor (N = 19), Ewing sarcoma (N = 7), schwannoma (N = 12), and neurofibroma plexiform (N = 7). Rare CNS tumors are displayed in Figure S3B. Histology (Cancer Group) and sex annotations are displayed under each plot. Only tumors with mutations in the listed genes are shown. Multiple CNVs are denoted as a complex event. N denotes the number of unique tumors (one tumor per patient).
Mutational co-occurrence, CNV, and signatures highlight key oncogenic drivers
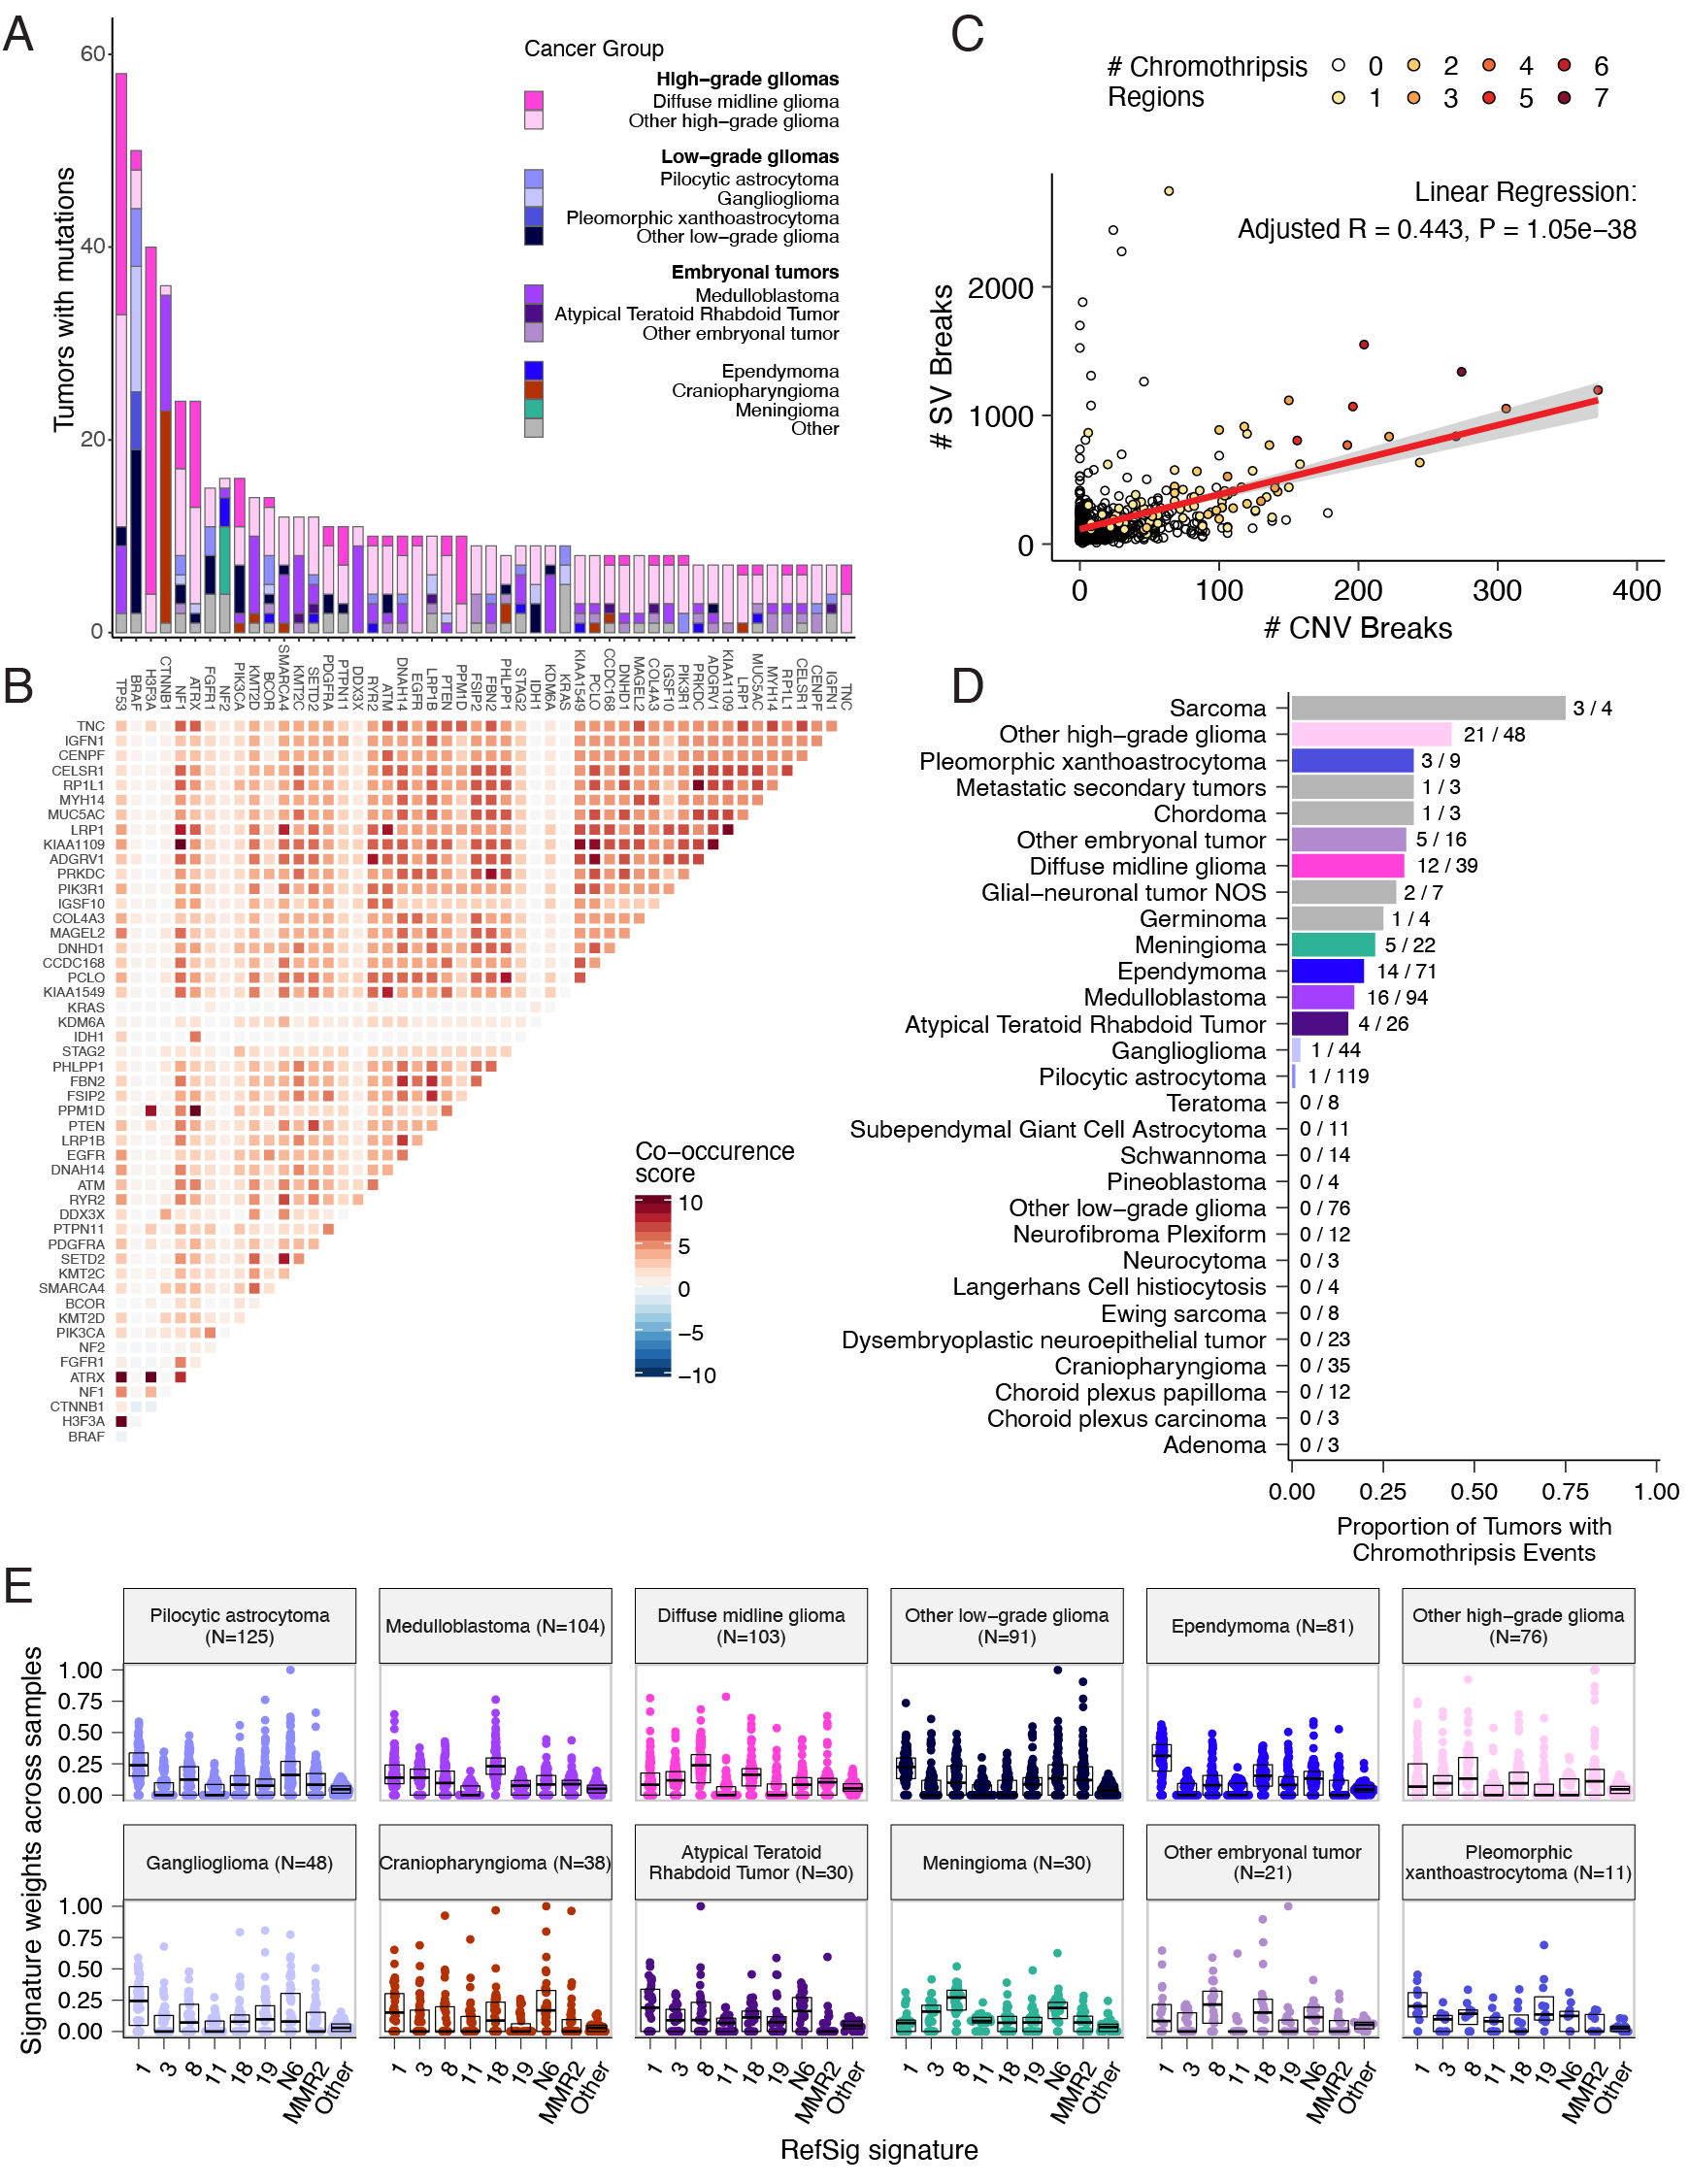
We analyzed mutational co-occurrence across the OpenPBTA, using a single tumor from each patient (N = 668) with WGS.
The top 50 mutated genes (see STAR Methods for details) in primary tumors are shown in Figure 3 by tumor type (A, bar plots), with co-occurrence scores illustrated in the heatmap (B).
As expected, TP53 was the most frequently mutated gene across the OpenPBTA (8.7%, 58/668), significantly co-occurring with H3F3A (OR = 30.05, 95% CI: 14.5 - 62.3, q = 2.34e-16), ATRX (OR = 23.3, 95% CI: 9.6 - 56.3, q = 8.72e-9), NF1 (OR = 8.26, 95% CI: 3.5 - 19.4, q = 7.40e-5), and EGFR (OR = 17.5, 95% CI: 4.8 - 63.9, q = 2e-4), with all of these driven by HGGs and consistent with previous reports31,35,36.
In embryonal tumors, CTNNB1 mutations significantly co-occurred with TP53 mutations (OR = 43.6 95% CI: 7.1 - 265.8, q = 1.52e-3) as well as with DDX3X mutations (OR = 21.4, 95% CI: 4.7 - 97.9, q = 4.15e-3), events driven by medulloblastomas as previously reported37,38.
FGFR1 and PIK3CA mutations significantly co-occurred in LGGs (OR = 77.25, 95% CI: 10.0 - 596.8, q = 3.12e-3), consistent with previous findings38,39.
Of HGG tumors with TP53 or PPM1D mutations, 53/55 (96.3%) had mutations in only one of these genes (OR = 0.17, 95% CI: 0.04 - 0.89, q = 0.056), recapitulating previous observations that these mutations are usually mutually exclusive in HGGs40.
CNV and SV analyses revealed that HGG, DMG, and medulloblastoma tumors had the most unstable genomes, while craniopharyngiomas and schwannomas generally lacked somatic CNV (Figure S3C).
These CNV patterns largely aligned with our TMB estimates (Figure S2H).
SV and CNV breakpoint densities were significantly correlated (linear regression p = 1.05e-38; Figure 3C), and as expected, the number of chromothripsis regions called increased with breakpoint density (Figure S3D-E).
We identified chromothripsis events in 31% (N = 12/39) of DMGs and in 44% (N = 21/48) of other HGGs (Figure 3D), and found evidence of chromothripsis in over 15% of sarcomas, PXAs, metastatic secondary tumors, chordomas, glial-neuronal tumors, germinomas, meningiomas, ependymomas, medulloblastomas, ATRTs, and other embryonal tumors.
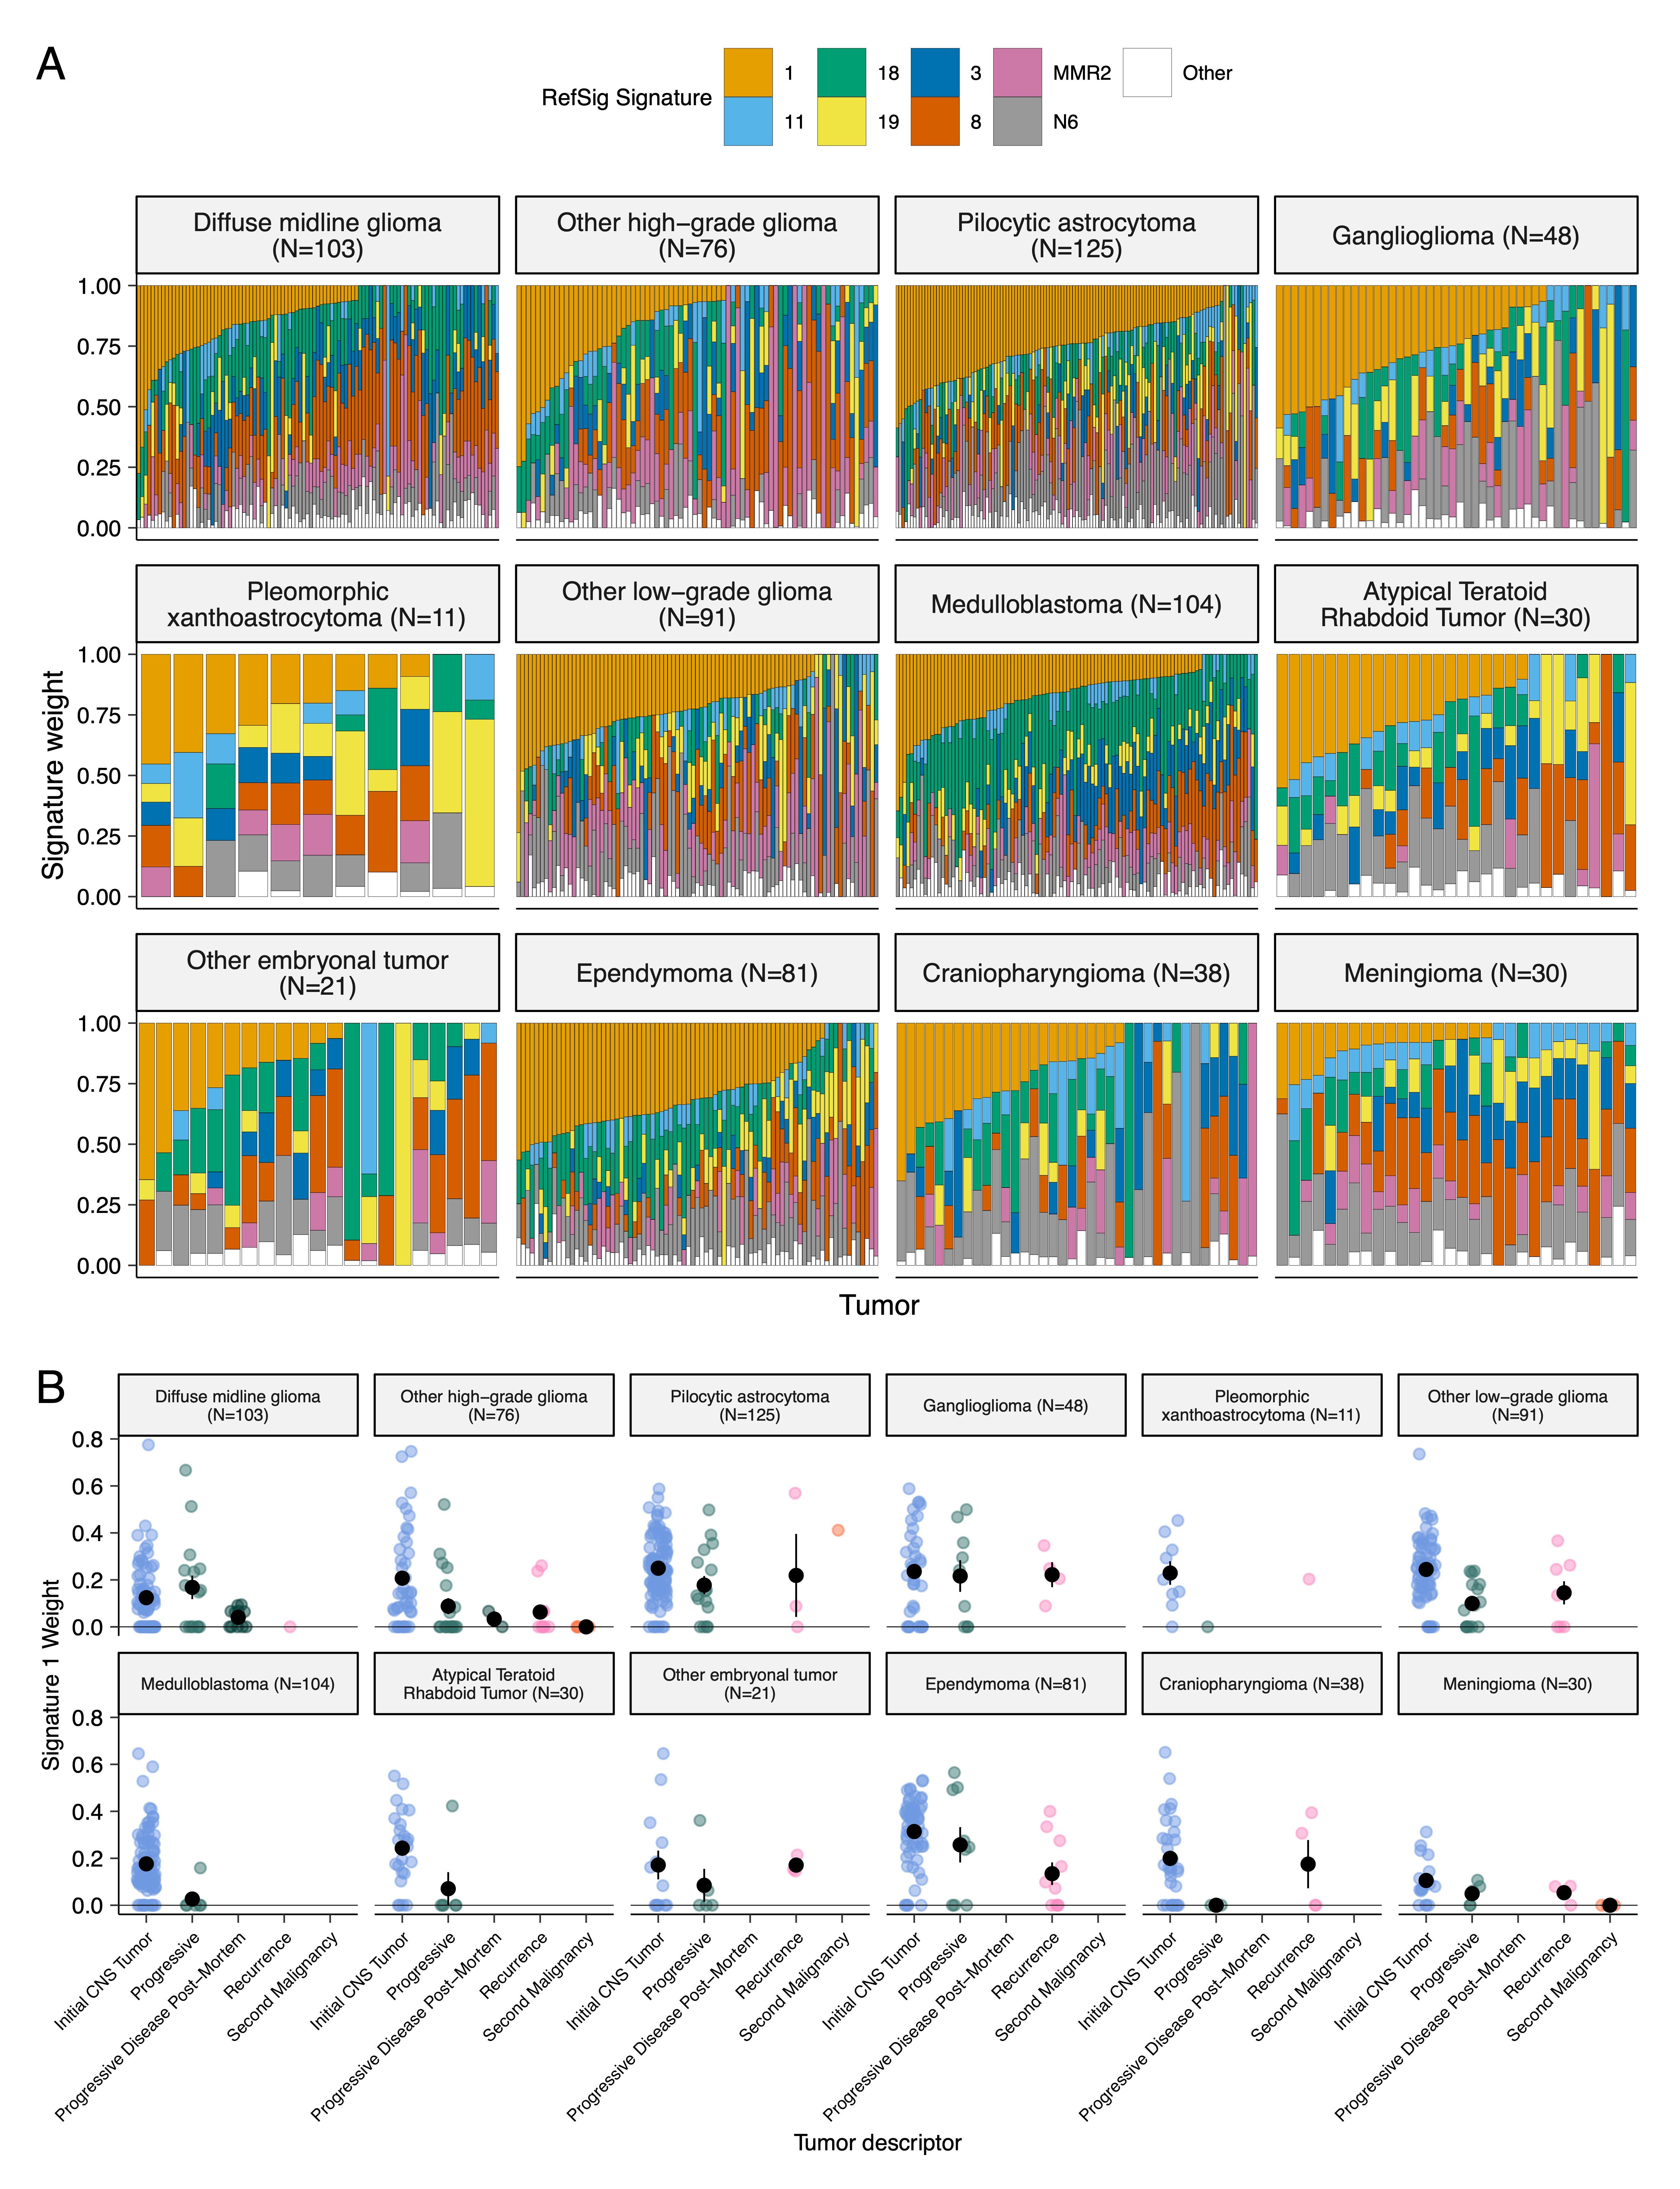
We assessed the contributions of eight adult CNS-specific mutational signatures from the RefSig database41 across tumors (Figure 3E and Figure S4A).
Signature 1, which reflects normal spontaneous deamination of 5-methylcytosine, predominated in stage 0 and/or 1 tumors characterized by low TMBs (Figure S2H) such as pilocytic astrocytomas, gangliogliomas, other LGGs, and craniopharyngiomas (Figure S4A).
Signature 1 weights were generally higher in tumors sampled at diagnosis (pre-treatment) compared to tumors from later phases of therapy (Figure S4B).
This trend may have emerged from therapy-induced mutations that produced additional signatures (e.g., temozolomide treatment has been suggested to drive Signature 1142), subclonal expansion, and/or acquisition of additional driver mutations during tumor progression, leading to detection of additional signatures.
We observed the CNS-specific signature N6 in nearly all tumors.
Signature 18 drivers (TP53, APC, NOTCH1; found at https://signal.mutationalsignatures.com/explore/referenceCancerSignature/31/drivers) are also canonical medulloblastoma drivers, and indeed, Signature 18 had the highest signature weight in medulloblastomas.
Finally, signatures 3, 8, 18, and MMR2 were prevalent in HGGs, including DMGs.
Figure 3:Mutational co-occurrence and signatures highlight key oncogenic drivers. A, Nonsynonymous mutations for 50 most commonly-mutated genes across all histologies. “Other” denotes a histology with <10 tumors. B, Co-occurrence and mutual exclusivity of mutated genes. The co-occurrence score is defined as \(I(-\log_{10}(P))\) where \(P\) is Fisher’s exact test and \(I\) is 1 when mutations co-occur more often than expected or -1 when exclusivity is more common. C, Number of SV and CNV breaks are significantly correlated (Adjusted R = 0.443, p = 1.05e-38). D, Chromothripsis frequency across cancer groups with N >= 3 tumors. E, Sina plots of RefSig signature weights for signatures 1, 11, 18, 19, 3, 8, N6, MMR2, and Other across cancer groups. Boxplot represents 5% (lower whisker), 25% (lower box), 50% (median), 75% (upper box), and 95% (upper whisker) quantiles.
Transcriptomic Landscape of Pediatric Brain Tumors
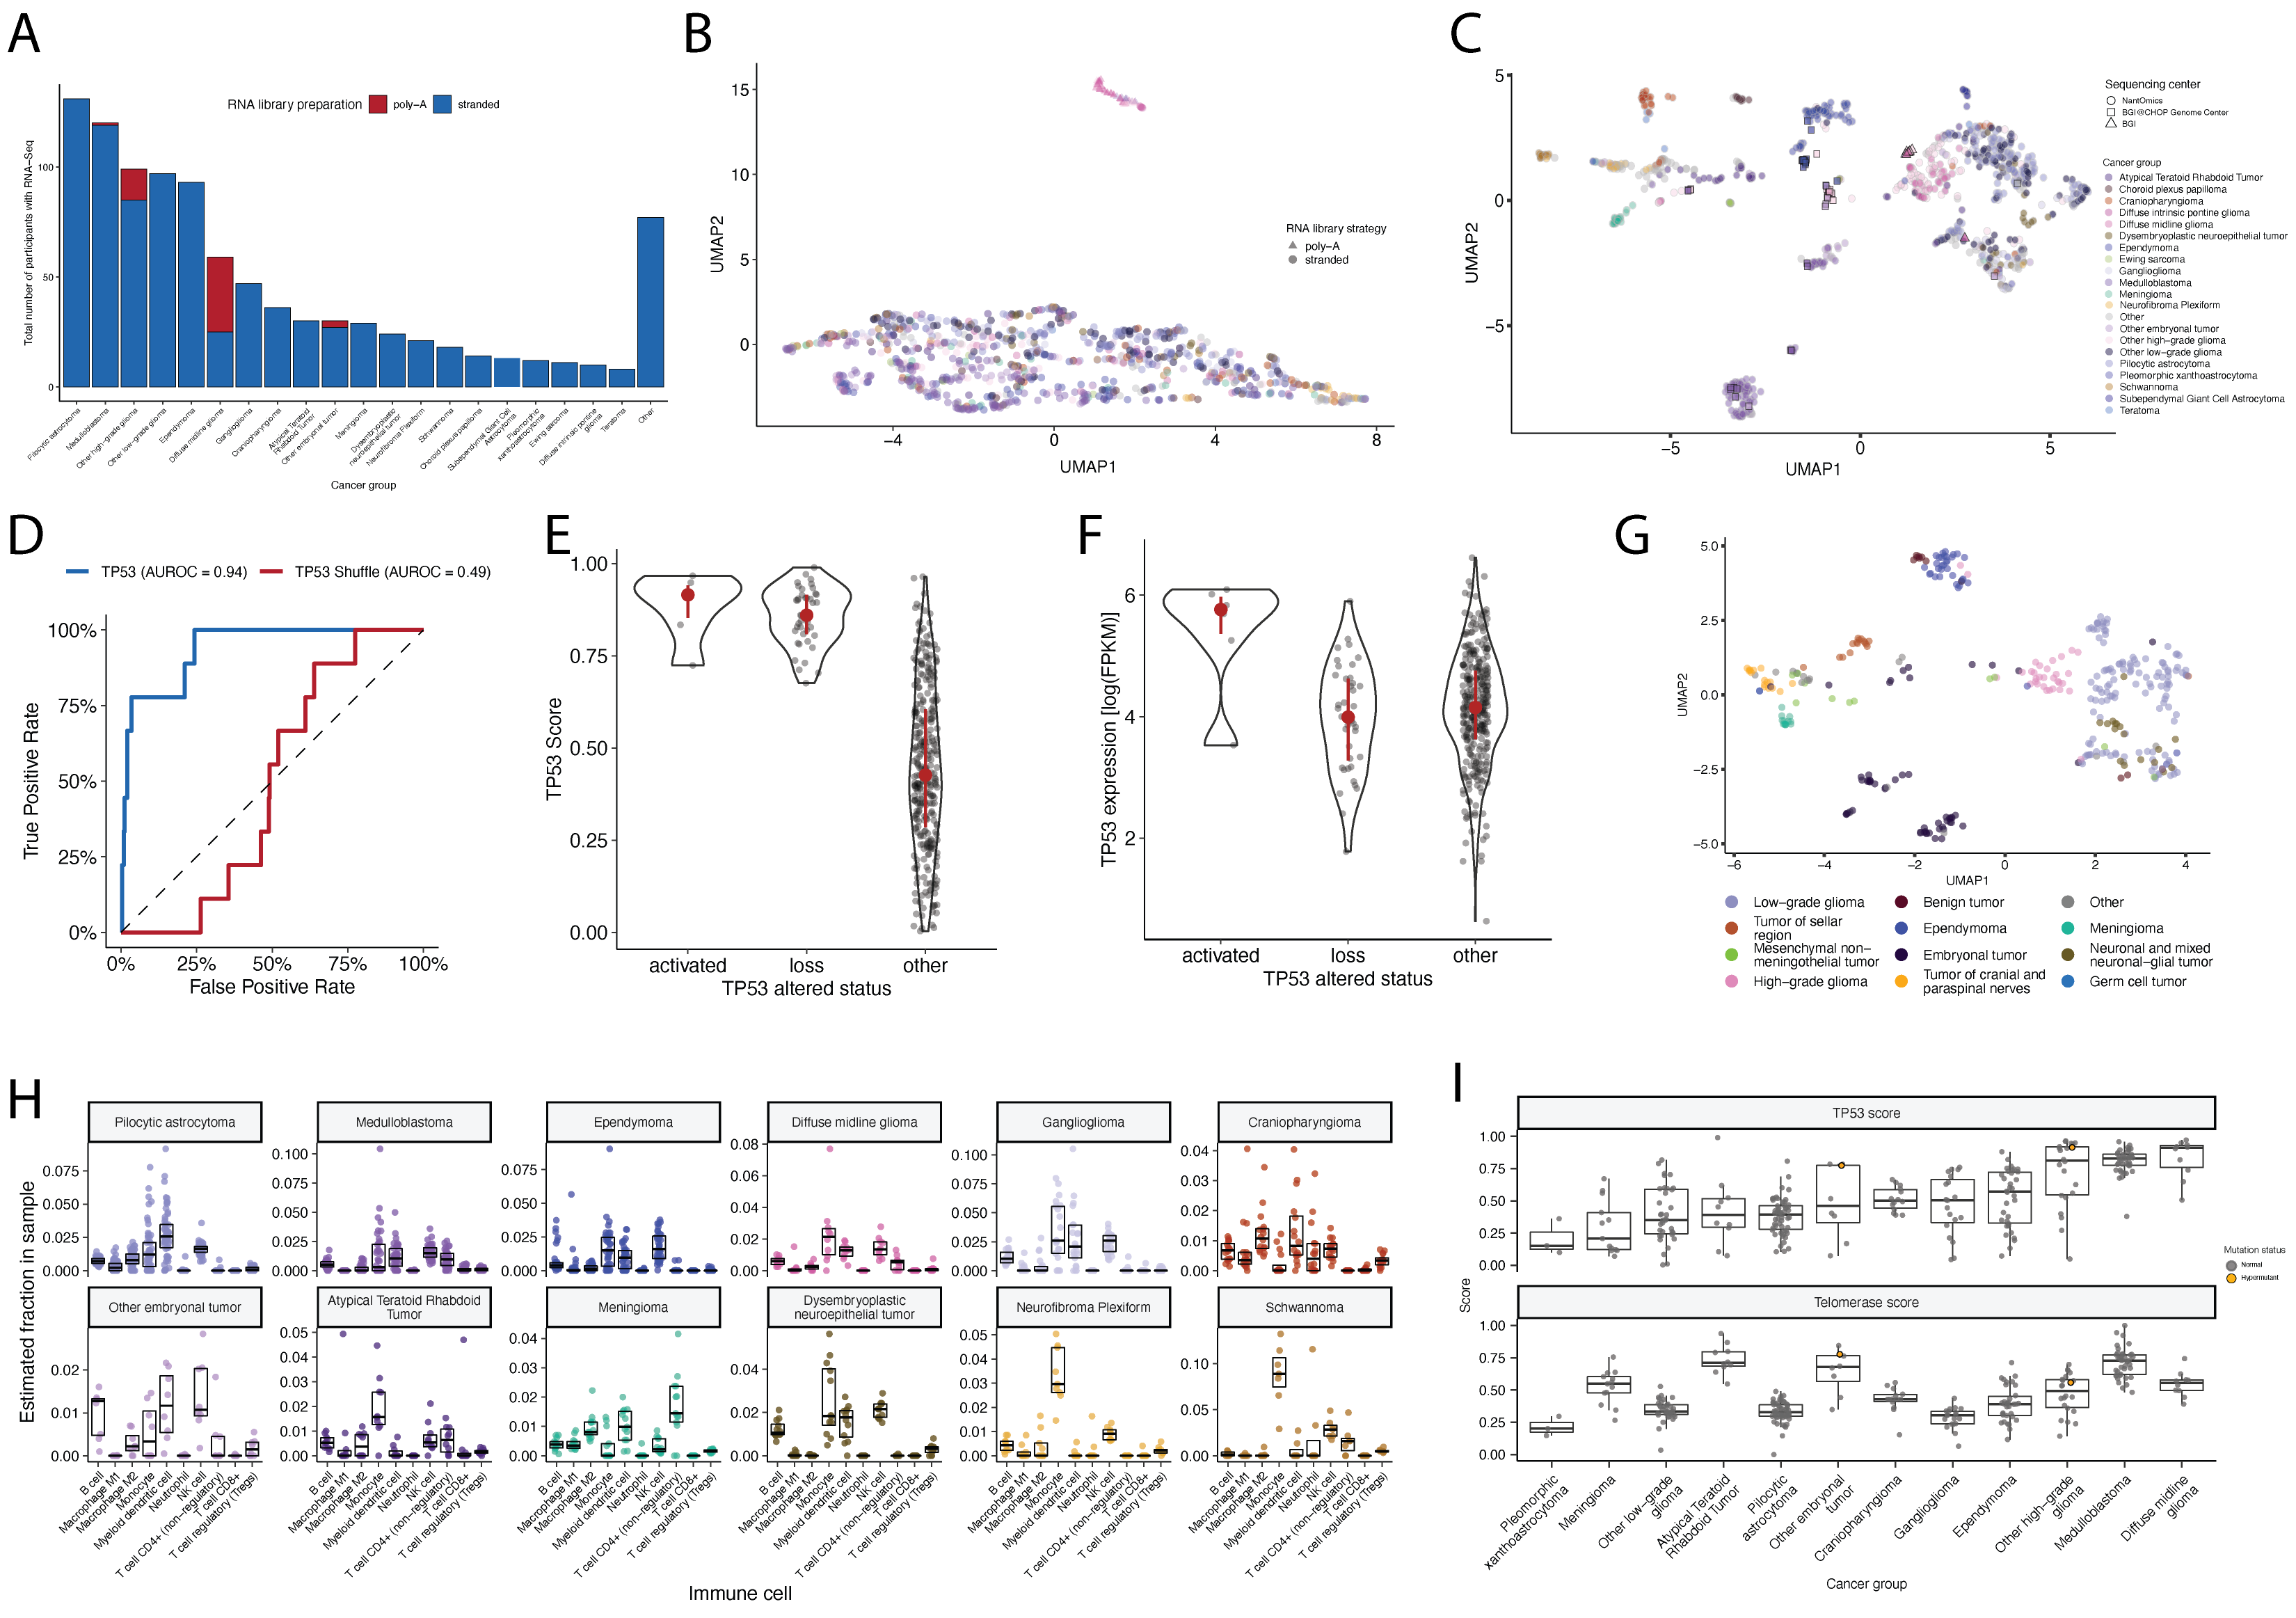
Most RNA-Seq samples in the PBTA were prepared with ribosomal RNA depletion followed by stranded sequencing (N = 977), while remaining samples were prepared with poly-A selection (N = 58).
Since batch correction was not feasible (see Limitations of the Study and Figure S7A), the following transcriptomic analyses considered only stranded samples.
Prediction of TP53 oncogenicity and telomerase activity
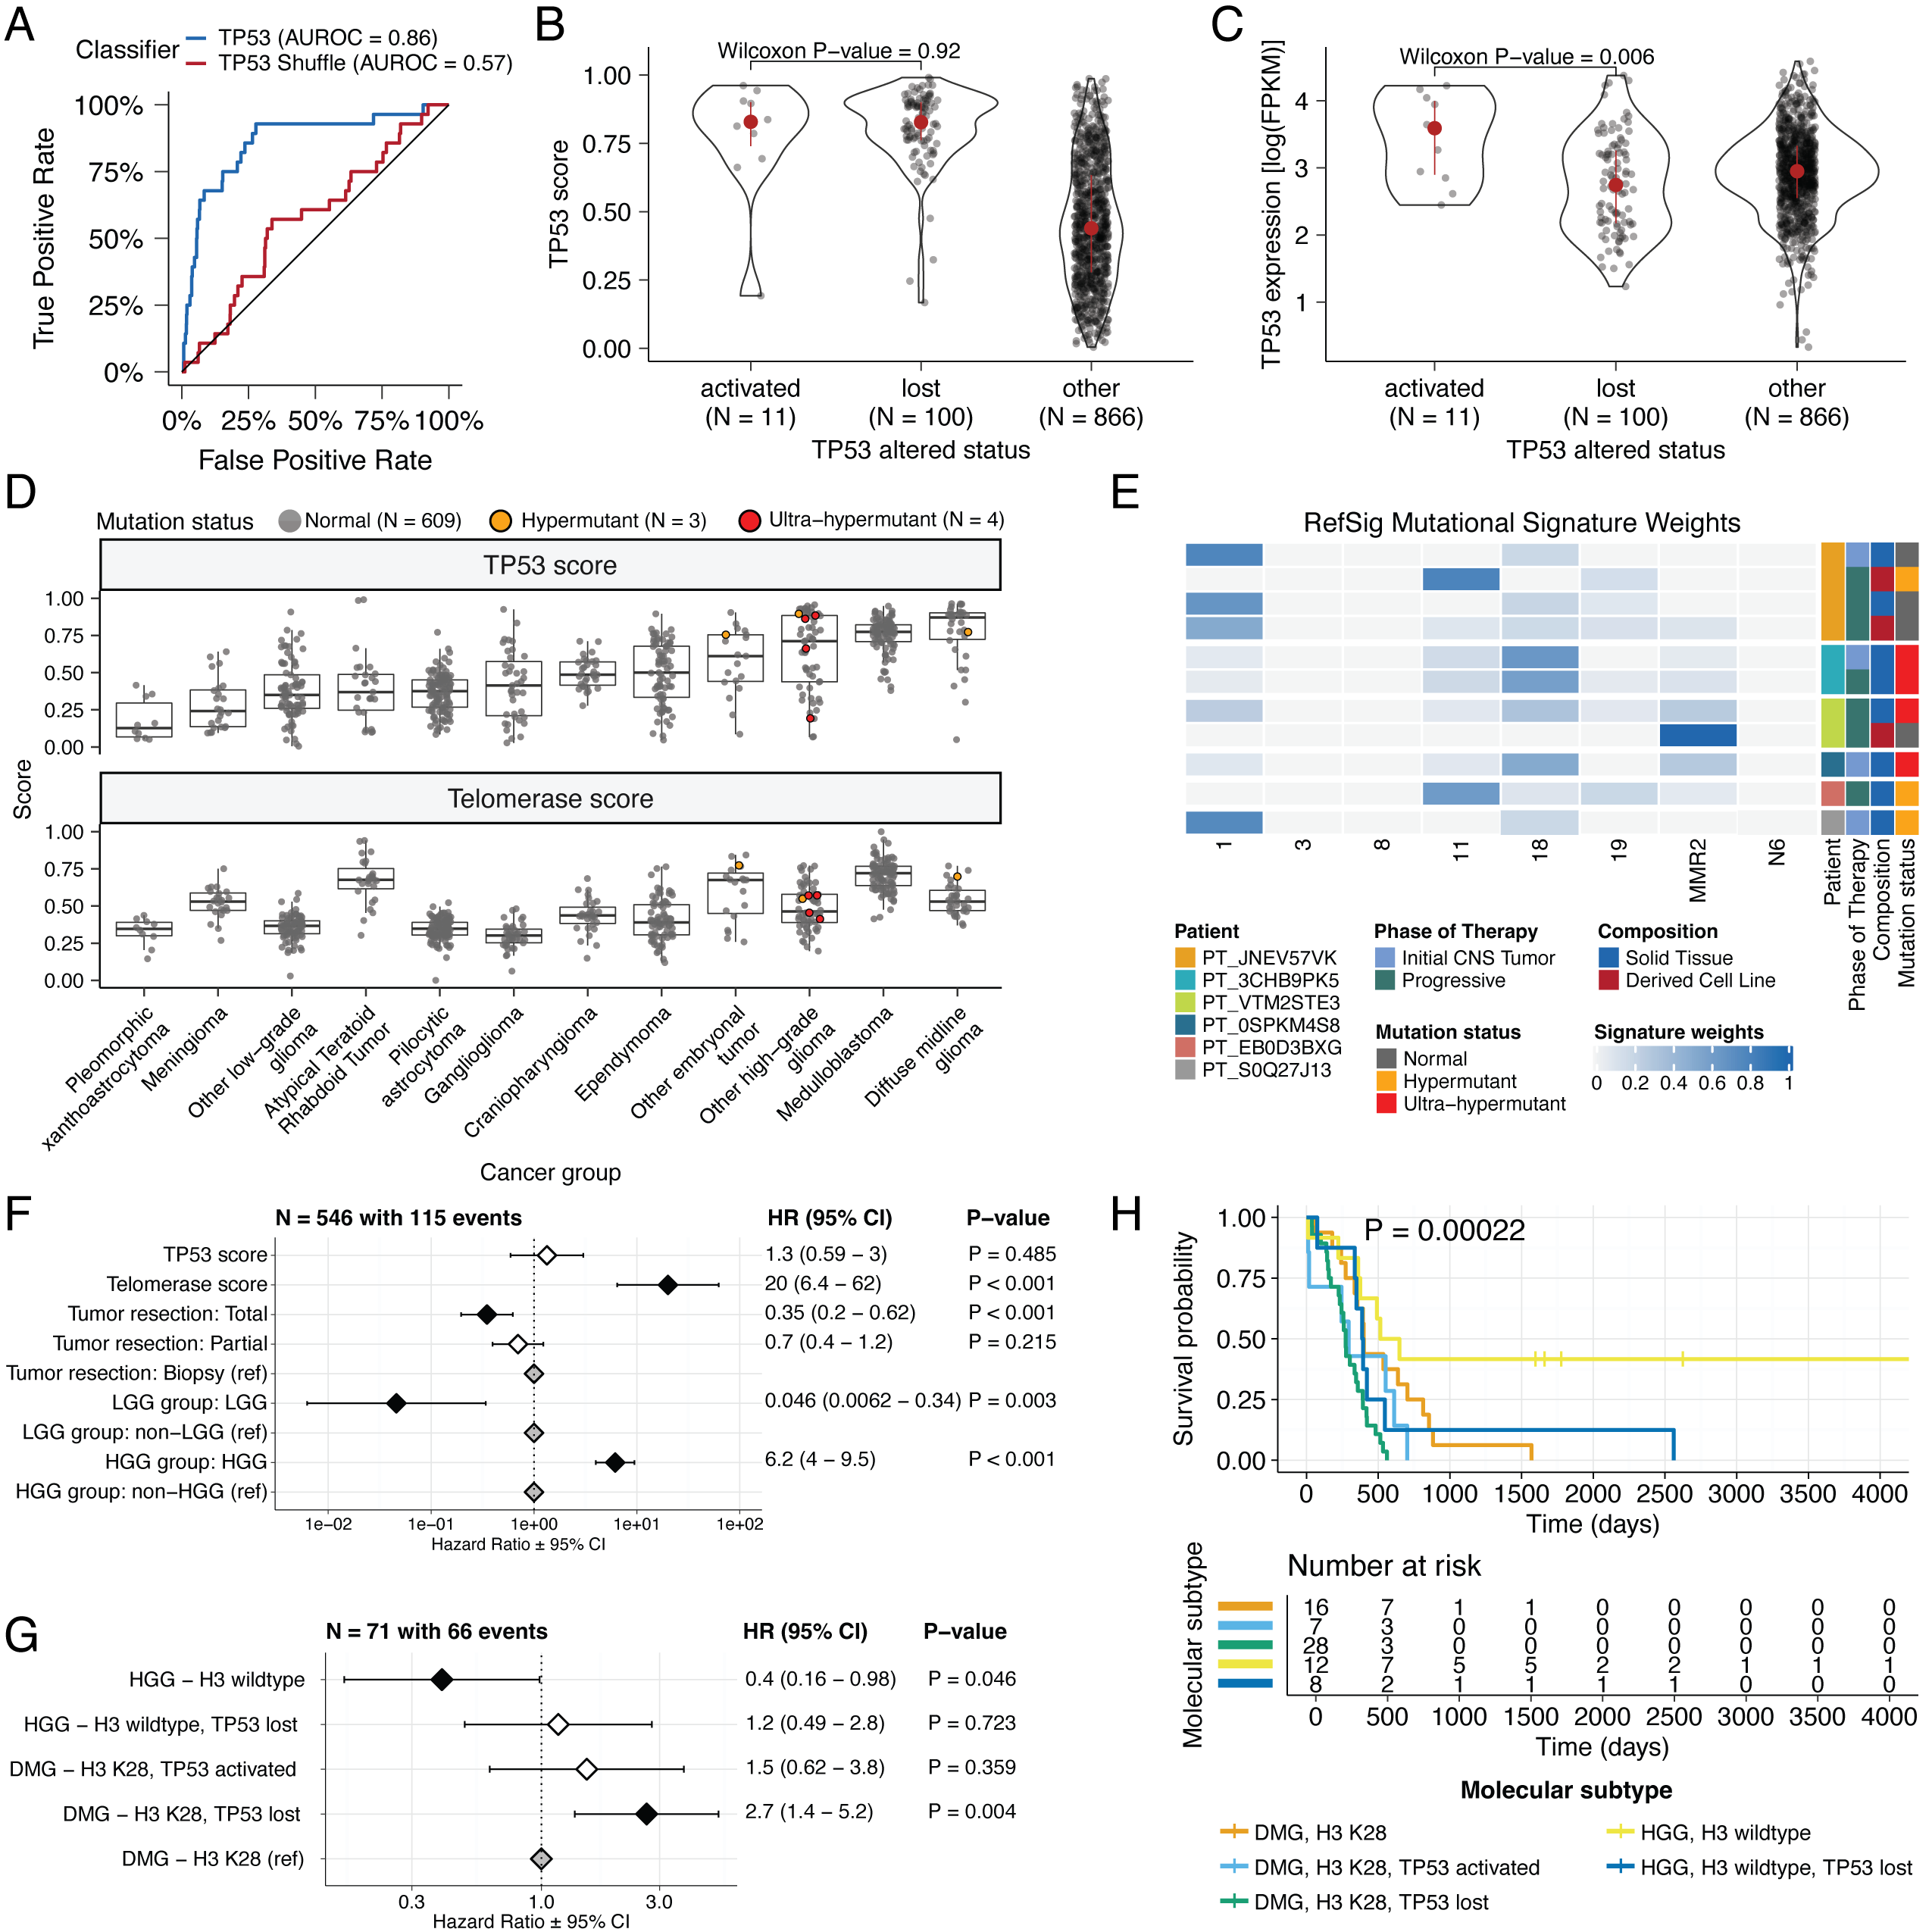
We applied a TCGA-trained classifier43 to calculate a TP53 score, a proxy for TP53 gene or pathway dysregulation, and subsequently infer tumor TP53 inactivation status.
We identified “true positive” TP53 alterations from high-confidence SNVs, CNVs, SVs, and fusions in TP53, annotating tumors as “activated” if they harbored one of p.R273C or p.R248W gain-of-function mutations44, or “lost” if 1) the patient had a Li Fraumeni Syndrome (LFS) predisposition diagnosis, 2) the tumor harbored a known hotspot mutation, or 3) the tumor contained two hits (e.g. both SNV and CNV), suggesting both alleles were affected.
If the TP53 mutation did not reside within the DNA-binding domain or no alterations in TP53 were detected, we annotated the tumor as “other,” indicating an unknown TP53 alteration status.
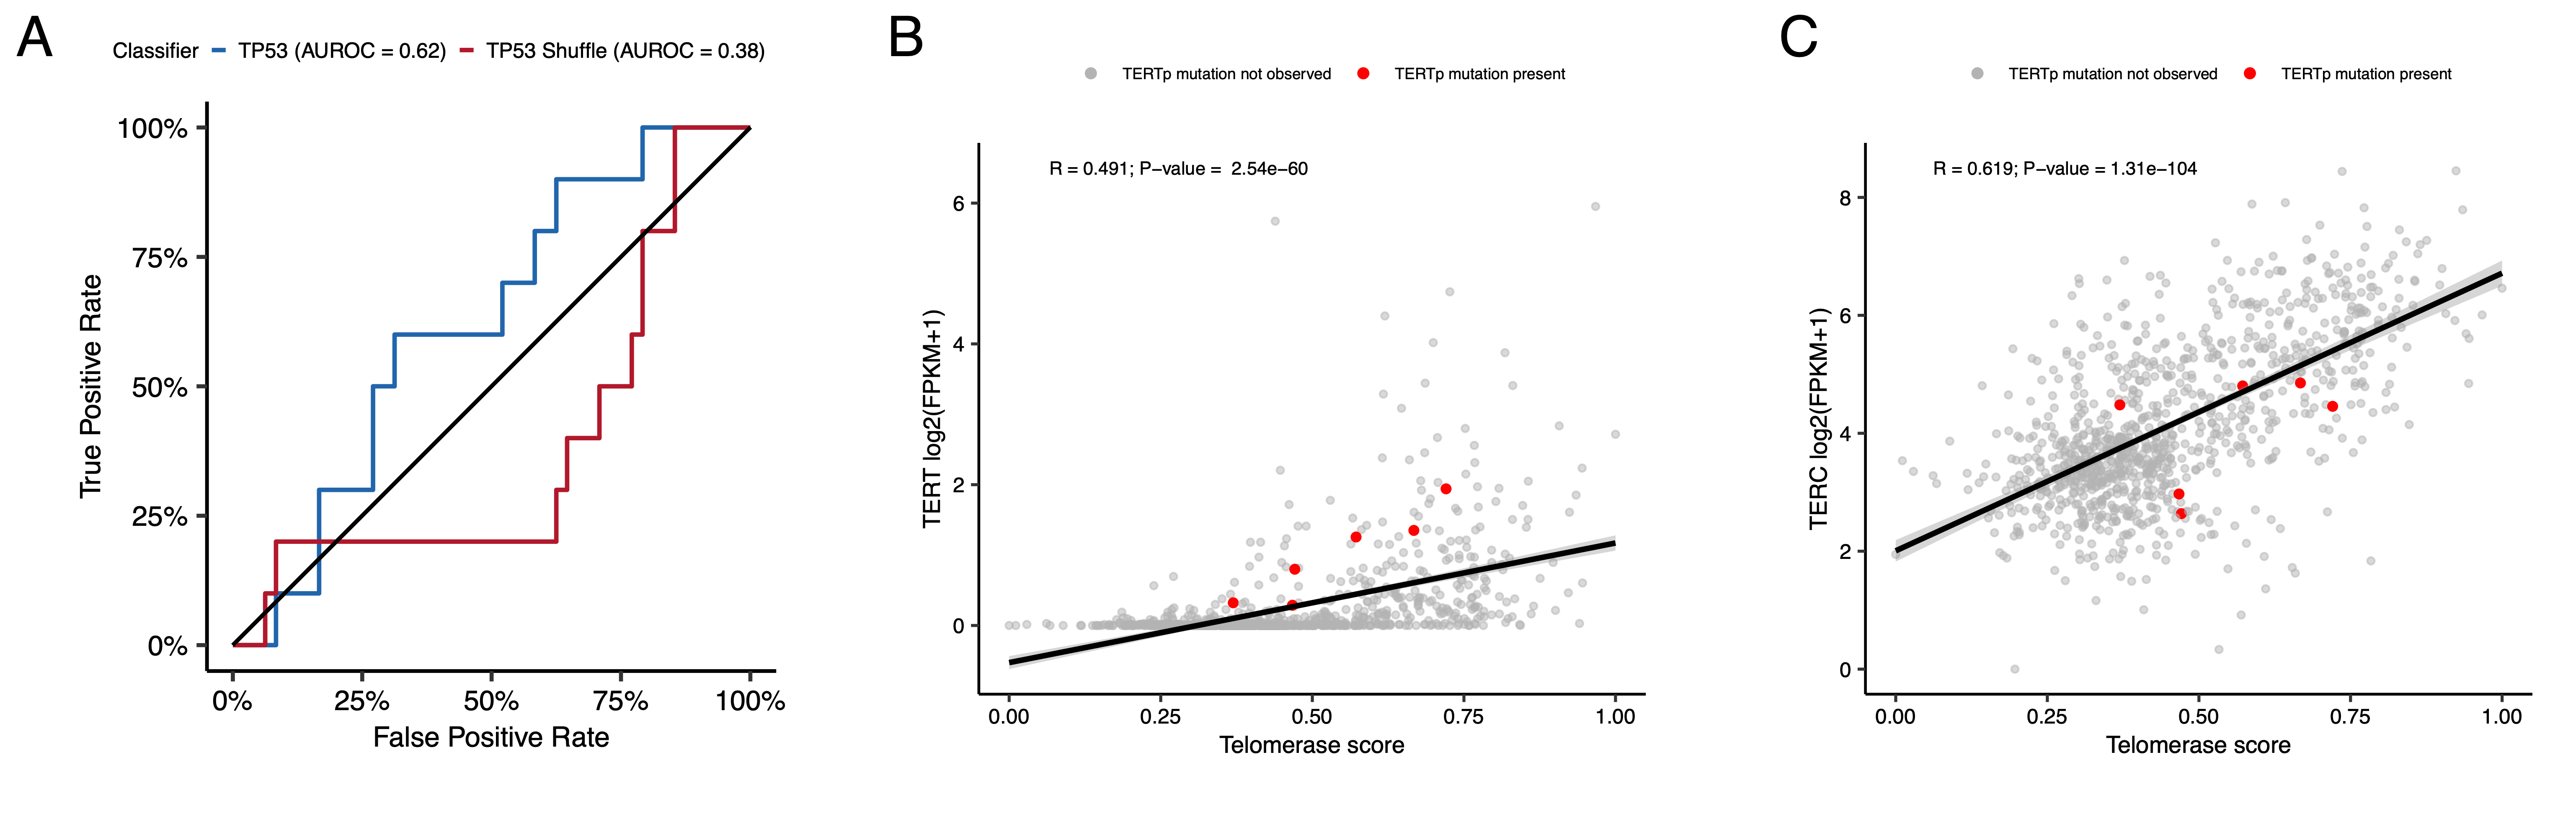
The classifier achieved a high accuracy (AUROC = 0.86) for rRNA-depleted, stranded tumors, but it did not perform as well on the poly-A tumors in this cohort (AUROC = 0.62; Figure S5A).
We observed that “activated” and “lost” tumors had similar TP53 scores (Figure 4B, Wilcoxon p = 0.92), contrasting our expectation that “lost” tumors would have higher TP53 scores.
This difference suggests that classifier scores > 0.5 may actually represent an oncogenic, or altered, TP53 phenotype rather than solely TP53 inactivation, as interpreted previously43.
However, “activated” tumors showed higher TP53 expression compared to those with TP53 “loss” mutations (Wilcoxon p = 0.006, Figure 4C).
DMGs, medulloblastomas, HGGs, DNETs, ependymomas, and craniopharyngiomas, all known to harbor TP53 mutations, had the highest median TP53 scores (Figure 4D).
By contrast, gangliogliomas, LGGs, meningiomas, and schwannomas had the lowest median scores.
We hypothesized that tumors (N = 10) from patients with LFS (N = 8) would have higher TP53 scores, which we indeed observed for 8/10 tumors (Table S3).
Although two tumors had low TP53 scores (BS_DEHJF4C7 at 0.09 and BS_ZD5HN296 at 0.28), pathology reports confirmed that both patients were diagnosed with LFS and harbored a TP53 pathogenic germline variant.
These two LFS tumors also had low tumor purity (16% and 37%, respectively), suggesting that accurate classification may require a certain level of tumor content.
We suggest this classifier could be generally applied to infer TP53 function in the absence of a predicted oncogenic TP53 alteration or DNA sequencing.
We used gene expression data to predict telomerase activity using EXpression-based Telomerase ENzymatic activity Detection (EXTEND)45 as a surrogate measure of malignant potential45,46, where higher EXTEND scores indicate higher telomerase activity.
Aggressive tumors such as DMGs, other HGGs, and MB had high EXTEND scores (Figure 4D), and low-grade lesions such as schwannomas, GNGs, DNETs, and other LGGs had among the lowest scores (Table S3), supporting previous reports that aggressive tumor phenotypes have higher telomerase activity47–50.
While EXTEND scores were not significantly higher in tumors with TERT promoter (TERTp) mutations (N = 6; Wilcoxon p-value = 0.1196), scores were significantly correlated with TERC (R = 0.619, p < 0.01) and TERT (R = 0.491, p < 0.01) log2 FPKM expression values (Figure S5B-C).
Since catalytically-active telomerase requires full-length TERT, TERC, and certain accessory proteins51, we expect that EXTEND scores may not be exclusively correlated with TERT alterations and expression.
Hypermutant tumors share mutational signatures and have dysregulated TP53
We investigated the mutational signature profiles of hypermutant (TMB > 10 Mut/Mb; N = 3) and ultra-hypermutant (TMB > 100 Mut/Mb; N = 4) tumors and/or derived cell lines from six patients in OpenPBTA (Figure 4E).
Five tumors were HGGs and one was a brain metastasis of a MYCN non-amplified neuroblastoma tumor.
Signature 11, which is associated with exposure to temozolomide plus MGMT promoter and/or mismatch repair deficiency52, was indeed present in tumors with previous exposure to the drug (Table 2).
We detected the MMR2 signature in tumors of four patients (PT_0SPKM4S8, PT_3CHB9PK5, PT_JNEV57VK, and PT_VTM2STE3) diagnosed with either constitutional mismatch repair deficiency (CMMRD) or Lynch syndrome (Table 2), genetic predisposition syndromes caused by a variant in a mismatch repair gene such as PMS2, MLH1, MSH2, MSH6, or others53.
Three of these patients harbored pathogenic germline variants in one of the aforementioned genes.
While we did not detect a known pathogenic variant in the germline of PT_VTM2STE3, this patient’s pathology report contained a self-reported PMS2 variant, and we indeed found 19 intronic variants of unknown significance (VUS) in their PMS2.
This is not surprising since an estimated 49% of germline PMS2 variants in patients with CMMRD and/or Lynch syndrome are VUS53.
Interestingly, while the cell line derived from patient PT_VTM2STE3’s tumor at progression was not hypermutated (TMB = 5.7 Mut/Mb), it only contained the MMR2 signature, suggesting selective pressure to maintain a mismatch repair (MMR) phenotype in vitro.
Only one of the two cell lines derived from patient PT_JNEV57VK’s progressive tumor was hypermutated (TMB = 35.9 Mut/Mb).
The hypermutated cell line was strongly weighted towards signature 11, while the non-hypermutated cell line showed several lesser signature weights (1, 11, 18, 19, MMR2; Table S2).
This mutational process plasticity highlights the importance of careful genomic characterization and model selection for preclinical studies.
Signature 18, which has been associated with high genomic instability and can induce a hypermutator phenotype41, was uniformly represented among hypermutant solid tumors.
Additionally, all hypermutant HGG tumors or cell lines had dysfunctional TP53 (Table 2), consistent with previous findings that tumors with high genomic instability signatures require TP53 dysregulation41.
With one exception, hypermutant and ultra-hypermutant tumors had high TP53 scores (> 0.5) and telomerase activity.
Interestingly, none of the hypermutant tumors showed evidence of signature 3 (present in homologous recombination deficient tumors), signature 8 (arises from double nucleotide substitutions/unknown etiology), or signature N6 (a universal CNS tumor signature).
The mutual exclusivity of signatures 3 and MMR2 corroborates previous suggestions that tumors do not generally feature both deficient homologous repair and mismatch repair43.
Table 2:Patients with hypermutant tumors. Patients with at least one hypermutant or ultra-hypermutant tumor or cell line. Pathogenic (P) or likely pathogenic (LP) germline variants, coding region TMB, phase of therapy, therapeutic interventions, cancer predisposition (CMMRD = Constitutional mismatch repair deficiency), and molecular subtypes are included.
Kids First Participant ID
Kids First Biospecimen ID
CBTN ID
Phase of therapy
Composition
Therapy post-biopsy
Cancer predisposition
Pathogenic germline variant
TMB
OpenPBTA molecular subtype
PT_0SPKM4S8
BS_VW4XN9Y7
7316-2640
Initial CNS Tumor
Solid Tissue
Radiation, Temozolomide, CCNU
None documented
NM_000535.7(PMS2):c.137G>T (p.Ser46Ile) (LP)
187.4
HGG, H3 wildtype, TP53 activated
PT_3CHB9PK5
BS_20TBZG09
7316-515
Initial CNS Tumor
Solid Tissue
Radiation, Temozolomide, Irinotecan, Bevacizumab
CMMRD
NM_000179.3(MSH6):c.3439-2A>G (LP)
307
HGG, H3 wildtype, TP53 loss
PT_3CHB9PK5
BS_8AY2GM4G
7316-2085
Progressive
Solid Tissue
Radiation, Temozolomide, Irinotecan, Bevacizumab
CMMRD
NM_000179.3(MSH6):c.3439-2A>G (LP)
321.6
HGG, H3 wildtype, TP53 loss
PT_EB0D3BXG
BS_F0GNWEJJ
7316-3311
Progressive
Solid Tissue
Radiation, Nivolumab
None documented
None detected
26.3
Metastatic NBL, MYCN non-amplified
PT_JNEV57VK
BS_85Q5P8GF
7316-2594
Initial CNS Tumor
Solid Tissue
Radiation, Temozolomide
Lynch Syndrome
NM_000251.3(MSH2):c.1906G>C (p.Ala636Pro) (P)
4.7
DMG, H3 K28, TP53 loss
PT_JNEV57VK
BS_HM5GFJN8
7316-3058
Progressive
Derived Cell Line
Radiation, Temozolomide, Nivolumab
Lynch Syndrome
NM_000251.3(MSH2):c.1906G>C (p.Ala636Pro) (P)
35.9
DMG, H3 K28, TP53 loss
PT_JNEV57VK
BS_QWM9BPDY
7316-3058
Progressive
Derived Cell Line
Radiation, Temozolomide, Nivolumab
Lynch Syndrome
NM_000251.3(MSH2):c.1906G>C (p.Ala636Pro) (P)
7.4
DMG, H3 K28, TP53 loss
PT_JNEV57VK
BS_P0QJ1QAH
7316-3058
Progressive
Solid Tissue
Radiation, Temozolomide, Nivolumab
Lynch Syndrome
NM_000251.3(MSH2):c.1906G>C (p.Ala636Pro) (P)
6.3
DMG, H3 K28, TP53 activated
PT_S0Q27J13
BS_P3PF53V8
7316-2307
Initial CNS Tumor
Solid Tissue
Radiation, Temozolomide, Irinotecan
None documented
None detected
15.5
HGG, H3 wildtype, TP53 activated
PT_VTM2STE3
BS_ERFMPQN3
7316-2189
Progressive
Derived Cell Line
Unknown
Lynch Syndrome
None detected
5.7
HGG, H3 wildtype, TP53 loss
PT_VTM2STE3
BS_02YBZSBY
7316-2189
Progressive
Solid Tissue
Unknown
Lynch Syndrome
None detected
274.5
HGG, H3 wildtype, TP53 activated
Next, we asked whether transcriptomic classification of TP53 dysregulation and/or telomerase activity recapitulate these oncogenic biomarkers’ known prognostic influence.
We identified several expected trends, including a significant overall survival benefit following full tumor resection (HR = 0.35, 95% CI = 0.2 - 0.62, p < 0.001) or if the tumor was an LGG (HR = 0.046, 95% CI = 0.0062 - 0.34, p = 0.003), and a significant risk if the tumor was an HGG (HR = 6.2, 95% CI = 4.0 - 9.5, p < 0.001) (Figure 4F; STAR Methods).
High telomerase scores were associated with poor prognosis across brain tumor histologies (HR = 20, 95% CI = 6.4 - 62, p < 0.001), demonstrating that EXTEND scores calculated from RNA-Seq are an effective rapid surrogate measure for telomerase activity.
Higher TP53 scores were associated with significant survival risks (Table S4) within DMGs (HR = 6436, 95% CI = 2.67 - 1.55e7, p = 0.03) and ependymomas (HR = 2003, 95% CI = 9.9 - 4.05e5, p = 0.005).
Given this result, we next assessed whether different HGG molecular subtypes carry different survival risks if stratified by TP53 status.
We found that DMG H3 K28 tumors with TP53 loss had significantly worse prognosis (HR = 2.8, CI = 1.4-5.6, p = 0.003) than those with wildtype TP53 (Figure 4G and Figure 4H), recapitulating results from two recent restrospective analyses of DIPG tumors10,54.
Figure 4:TP53 and telomerase activity A, Receiver Operating Characteristic for TP53 classifier run on stranded FPKM RNA-Seq. B, Violin and strip plots of TP53 scores plotted by TP53 alteration type (Nactivated = 11, Nlost = 100, Nother = 866). C, Violin and strip plots of TP53 RNA expression plotted by TP53 activation status (Nactivated = 11, Nlost = 100, Nother = 866). D, Boxplots of TP53 and telomerase (EXTEND) scores across cancer groups. TMB status is highlighted in orange (hypermutant) or red (ultra-hypermutant). E, Heatmap of RefSig mutational signatures for patients with at least one hypermutant tumor or cell line. F, Forest plot depicting prognostic effects of TP53 and telomerase scores on overall survival (OS), controlling for extent of tumor resection, LGG group, and HGG group. G, Forest plot depicting the effect of molecular subtype on HGG OS. Hazard ratios (HR) with 95% confidence intervals and p-values (multivariate Cox) are given in F and G. Black diamonds denote significant p-values, and gray diamonds denote reference groups. H, Kaplan-Meier curve of HGGs by molecular subtype. Boxplot represents 5% (lower whisker), 25% (lower box), 50% (median), 75% (upper box), and 95% (upper whisker) quantiles.
Histologic and oncogenic pathway clustering
UMAP visualization of gene expression variation across brain tumors (Figure 5A) showed expected histological clustering of brain tumors.
We further observed that, except for three outliers, C11orf95::RELA (ZFTA::RELA) fusion-positive ependymomas fell within distinct clusters (Figure S6A).
Medulloblastoma (MB) tumors clustered by molecular subtype, with WNT and SHH in distinct clusters and Groups 3 and 4 showing some expected overlap (Figure S6B).
Notably, two MB tumors annotated as SHH did not cluster with the other MB tumors and one clustered with Group 3/4 tumors, suggesting potential subtype misclassification or different underlying biology of these two tumors.
BRAF-driven LGGs (Figure S6C) fell into three separate clusters, suggesting additional shared biology within each cluster.
Histone H3 G35-mutant HGGs generally clustered together and away from K28-mutant tumors (Figure S6D).
Interestingly, although H3 K28-mutant and H3 wildtype tumors have different biological drivers55, they did not form distinct clusters.
This pattern suggests these subtypes may be driven by common transcriptional programs, have other much stronger biological drivers than their known distinct epigenetic drivers, or we lack power to detect transcriptional differences.
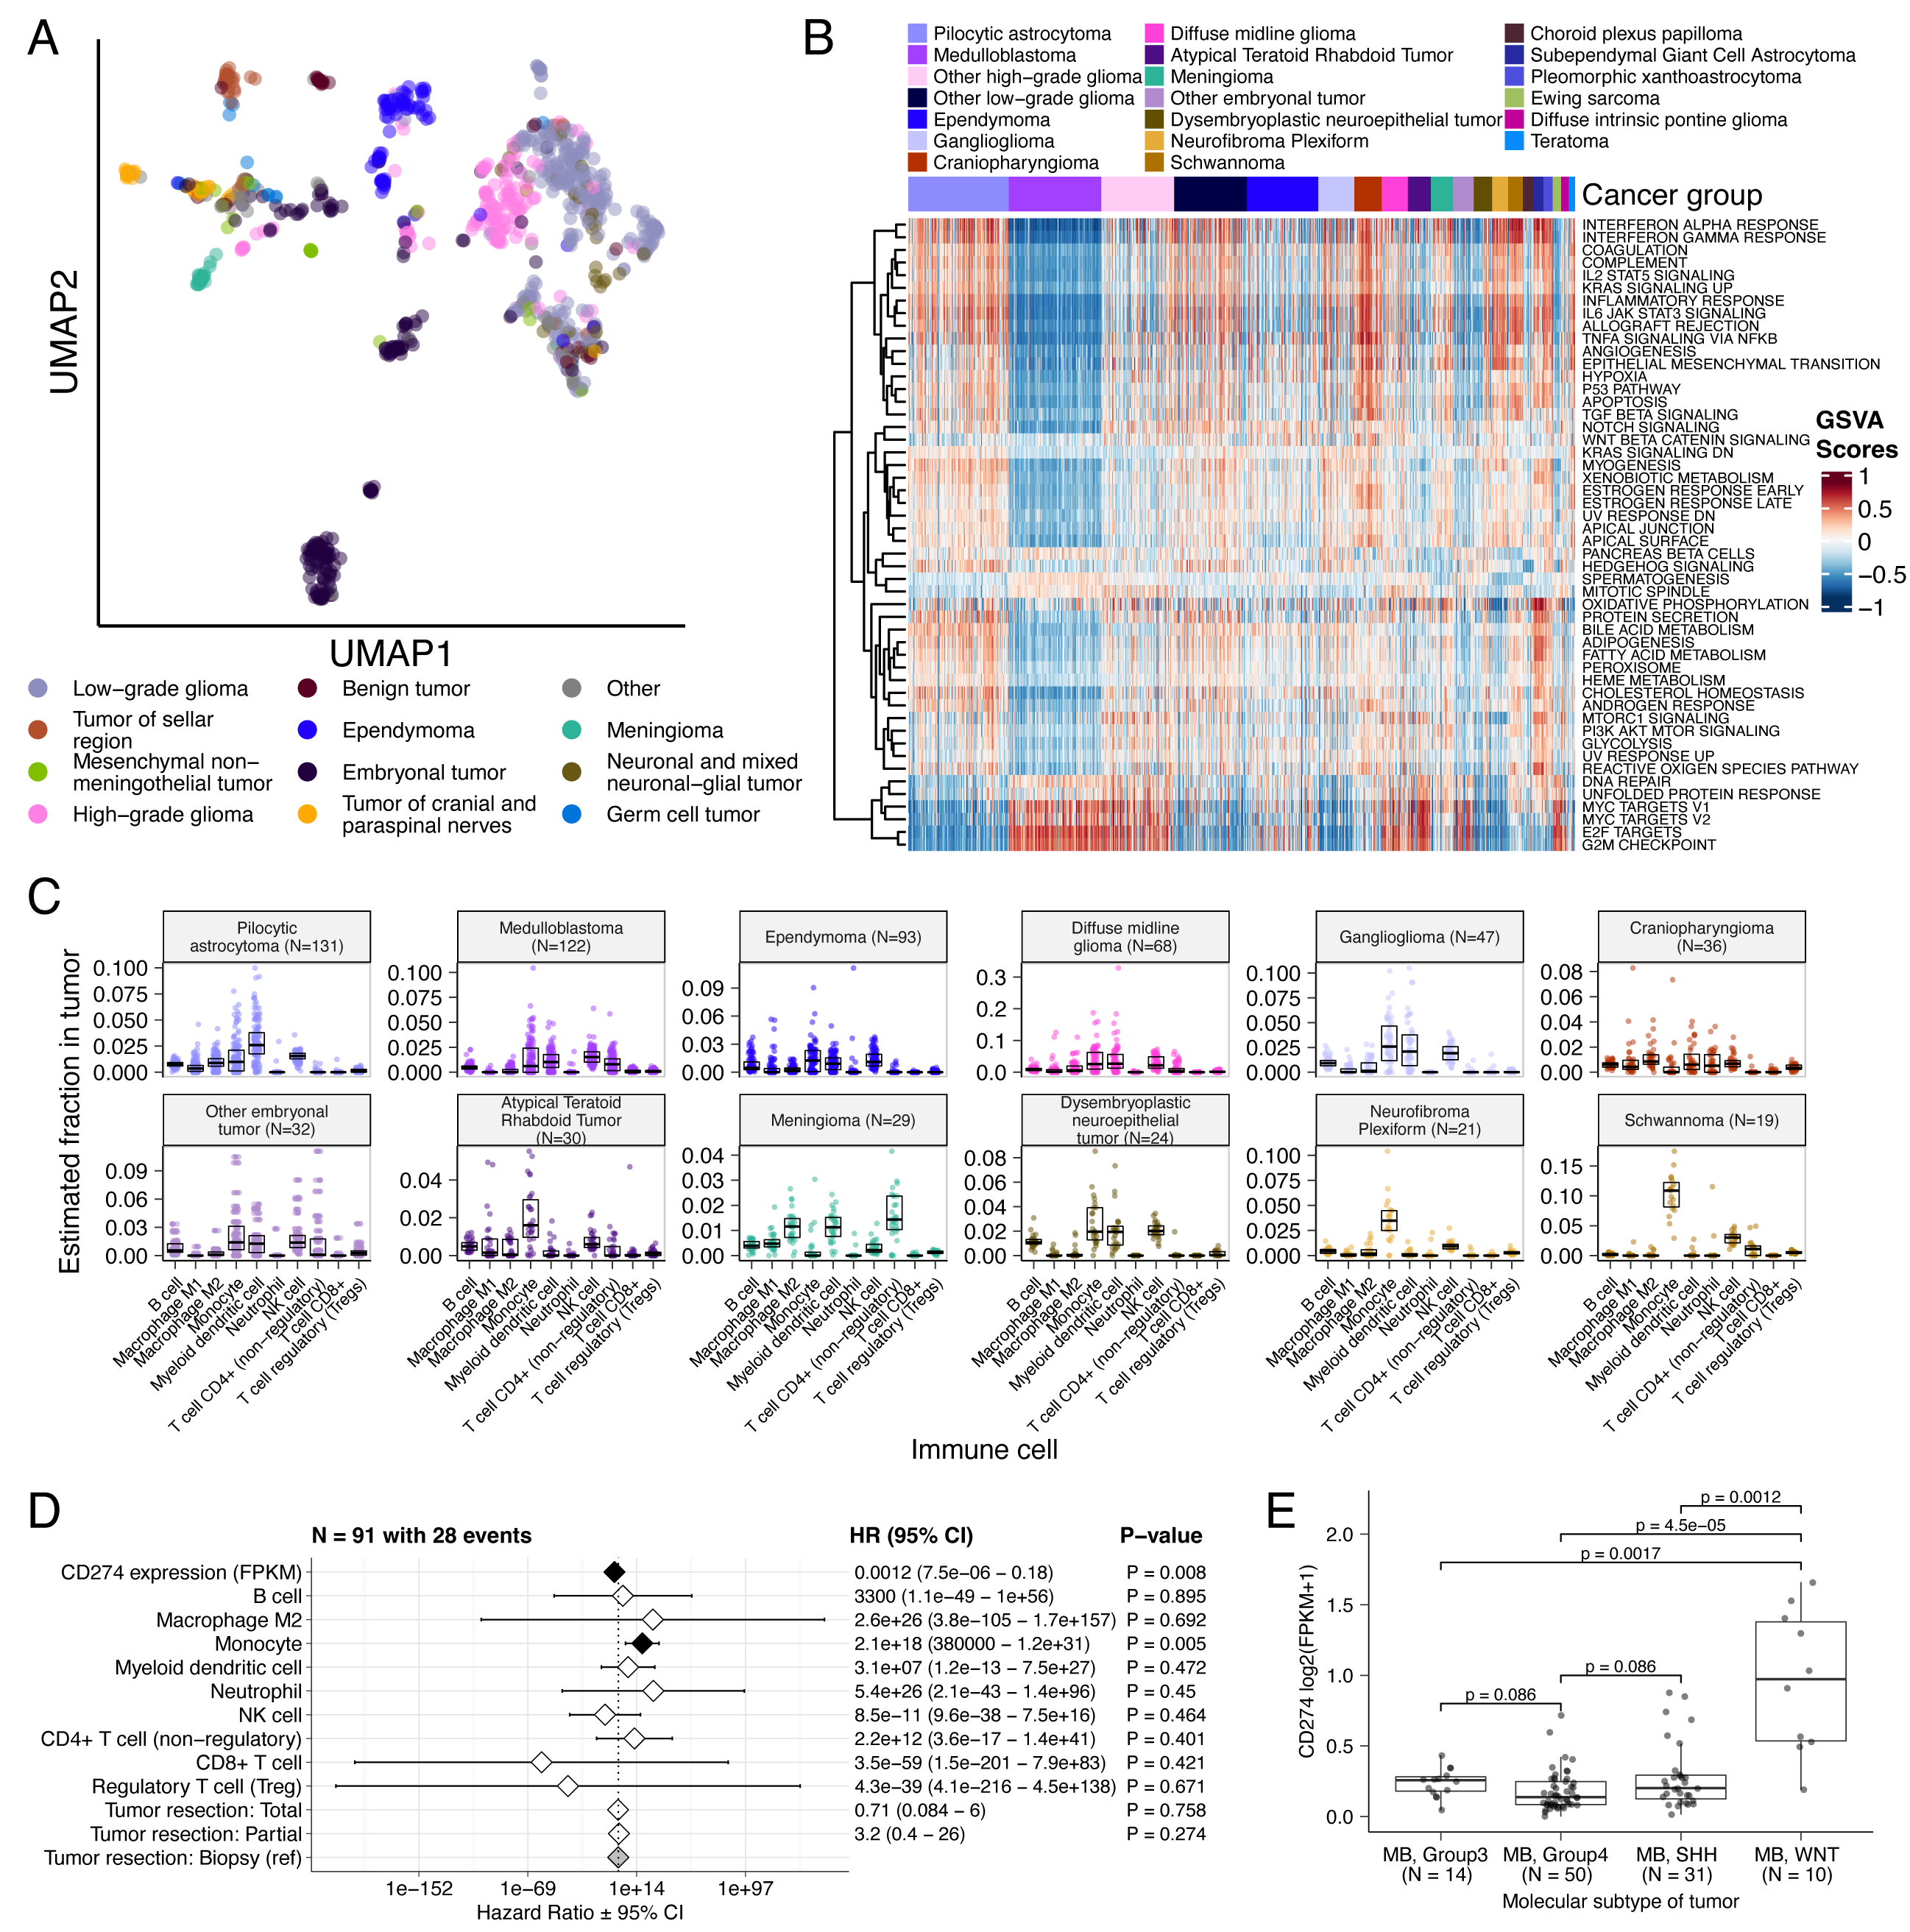
We performed GSVA for Hallmark cancer gene sets (Figure 5B) and quantified immune cell fractions using quanTIseq (Figure 5C and Figure S6E), results from which recapitulated previously-described tumor biology.
For example, HGG, DMG, MB, and ATRT tumors are known to upregulate MYC56 which in turn activates E2F and S phase57.
Indeed, we detected significant (Bonferroni-corrected p < 0.05) upregulation of MYC and E2F targets, as well as G2M (cell cycle phase following S phase) in MBs, ATRTs, and HGGs compared to several other cancer groups.
In contrast, LGGs showed significant downregulation (Bonferroni-corrected p < 0.05, multiple cancer group comparisons) of these pathways.
Schwannomas and neurofibromas, which have an inflammatory immune microenvironment of T and B lymphocytes and tumor-associated macrophages (TAMs), are driven by upregulation of cytokines such as IFN\(\gamma\), IL-1, and IL-6, and TNF\(\alpha\)58.
GSVA revealed significant upregulation of these cytokines in hallmark pathways (Bonferroni-corrected p < 0.05, multiple cancer group comparisons) (Figure 5B), and monocytes dominated these tumors’ immune cell repertoire (Figure 5C).
We also observed significant upregulation of pro-inflammatory cytokines IFN\(\alpha\) and IFN\(\gamma\) in both LGGs and craniopharyngiomas when compared to either medulloblastoma or ependymomas (Bonferroni-corrected p < 0.05) (Figure 5B).
Together, these results support previous proteogenomic findings that aggressive medulloblastomas and ependymomas have lower immune infiltration compared to BRAF-driven LGGs and craniopharyngiomas59.
Although CD8+ T-cell infiltration across all cancer groups was minimal (Figure 5C), we observed signal in specific cancer molecular subtypes (Groups 3 and 4 medulloblastoma) as well as outlier tumors (BRAF-driven LGG, BRAF-driven and wildtype ganglioglioma, and CNS embryonal NOS; Figure S6E)
Surprisingly, the classically immunologically-cold HGGs and DMGs60,61 contained higher overall fractions of immune cells, primarily monocytes, dendritic cells, and NK cells (Figure 5C).
Thus, quanTIseq might have actually captured microglia within these immune cell fractions.
While we did not detect notable prognostic effects of immune cell infiltration on overall survival in HGGs or DMGs, we found that high levels of macrophage M1 and monocytes were associated with poorer overall survival (monocyte HR = 2.1e18, 95% CI = 3.80e5 - 1.2e31, p = 0.005, multivariate Cox) in medulloblastomas (Figure 5D).
We further reproduced previous findings (Figure 5E) that medulloblastomas typically have low expression of CD274 (PD-L1)62.
We also found that higher expression of CD274 was significantly associated with improved overall prognosis for medulloblastoma tumors, although marginal (HR = 0.0012, 95% CI = 7.5e−06 - 0.18, p = 0.008, multivariate Cox) (Figure 5D).
This result may be explained by the higher expression of CD274 observed in WNT subtype tumors by us and others63, as this diagnosis carries the best prognosis of all medulloblastoma subgroups (Figure 5E).
We additionally explored the ratio of CD8+ to CD4+ T cells across tumor subtypes.
This ratio has been associated with better immunotherapy response and prognosis following PD-L1 inhibition in non-small cell lung cancer or adoptive T cell therapy in multiple stage III or IV cancers64,65.
While adamantinomatous craniopharyngiomas and Group 3 and Group 4 medulloblastomas had the highest ratios (Figure S6F), very few tumors had ratios greater than 1, highlighting an urgent need to identify novel therapeutics for pediatric brain tumors with poor prognosis.
Finally, we explored the potential influence of tumor purity by repeating selected transcriptomic analyses restricted to only samples with high tumor purity (see STAR Methods).
Results from these analyses were broadly consistent (Figure S7D-I) with results derived from all stranded RNA-Seq samples.
Figure 5:Transcriptomic and immune landscape of pediatric brain tumors A, First two dimensions of transcriptome data UMAP, with points colored by broad histology. B, Heatmap of GSVA scores for Hallmark gene sets with tumors ordered by cancer group. C, Boxplots of quanTIseq estimates of immune cell proportions in cancer groups with N > 15 tumors. Note: other HGGs and other LGGs have immune cell proportions similar to DMG and pilocytic astrocytoma, respectively, and are not shown. D, Forest plot depicting additive effects of CD274 expression, immune cell proportion, and extent of tumor resection on OS of medulloblastoma patients. HRs with 95% confidence intervals and p-values (multivariate Cox) are listed. Black diamonds denote significant p-values, and gray diamonds denote reference groups. Note: the Macrophage M1 HR was 0 (coefficient = -9.90e+4) with infinite upper and lower CIs, and thus was not included in the figure. E, Boxplot of CD274 expression (log2 FPKM) for medulloblastomas grouped by subtype. Bonferroni-corrected p-values from Wilcoxon tests are shown. Boxplot represents 5% (lower whisker), 25% (lower box), 50% (median), 75% (upper box), and 95% (upper whisker) quantiles. Only stranded RNA-Seq data is plotted.
Discussion
The CBTN released the PBTA raw genomic data in September 2018 without embargo, allowing researchers immediate access to begin making discoveries on behalf of children with CNS tumors everywhere.
Since this publication, the CBTN has approved over 200 data research projects4 from 69 different institutions, with 60% from non-CBTN sites.
We created OpenPBTA as an open, real-time, reproducible analysis framework to genomically characterize pediatric brain tumors, bringing together basic and translational researchers, clinicians, and data scientists.
We provide reusable code and data resources, paired with cloud-based availability of source and derived data resources, to the pediatric oncology community, encouraging interdisciplinary collaboration.
To our knowledge, this initiative represents the first large-scale, collaborative, open analysis of genomic data coupled with open manuscript writing, wherein we comprehensively analyzed the PBTA cohort.
Using available WGS, WXS, and RNA-Seq data, we generated high-confidence consensus SNV and CNV calls, prioritized putative oncogenic fusions, and established over 40 scalable and rigorously-reviewed modules to perform common downstream cancer genomics analyses.
We detected expected patterns of genomic lesions, mutational signatures, and aberrantly regulated signaling pathways across multiple pediatric brain tumor histologies.
Assembling large, pan-histology cohorts of fresh frozen samples and associated clinical phenotypes and outcomes requires a multi-year, multi-institutional framework, like those provided by CBTN and PNOC.
As such, uniform clinical molecular subtyping was largely not performed for this cohort at the time of sample collection.
Since DNA methylation data for these samples were not yet available to classify molecular subtypes, we created RNA- and DNA-based subtyping modules aligned with WHO molecularly-defined diagnoses.
We worked closely with pathologists and clinicians to assign research-grade integrated diagnoses for 60% of tumors while discovering incorrectly diagnosed or mis-identified samples in the OpenPBTA cohort.
For example, we subtyped medulloblastoma tumors, of which only 35% (43/122) had prior subtype information from pathology reports, using MMS2 or MedulloClassifier22,23 and subsequently applied the consensus of these methods to subtype all medulloblastomas.
We advanced the integrative analyses and cross-cohort comparison via a number of validated modules.
We used an expression classifier to determine whether tumors have dysfunctional TP5343 and the EXTEND algorithm to determine their degree of telomerase activity using a 13-gene signature45.
Interestingly, we found that hypermutant HGGs universally displayed TP53 dysregulation, unlike adult cancers like colorectal cancer and gastric adenocarcinoma where TP53 dysregulation in hypermutated tumors is less common66,67.
Furthermore, high TP53 scores were a significant prognostic marker for poor overall survival for patients with tumor types including H3 K28-mutant DMGs and ependymomas.
We also show that EXTEND scores are a robust surrogate measure for telomerase activity in pediatric brain tumors.
By assessing TP53 and telomerase activity prospectively from expression data, information usually only attainable with DNA sequencing and/or qPCR, we incorporated oncogenic biomarker and prognostic knowledge thereby expanding our biological understanding of these tumors.
We identified enrichment of hallmark cancer pathways and characterized the immune cell landscape across pediatric brain tumors, demonstrating tumors in some histologies, such as schwannomas, craniopharyngiomas, and low-grade gliomas, may have a inflammatory tumor microenvironment.
Notably, we observed upregulation of IFN\(\gamma\), IL-1, and IL-6, and TNF\(\alpha\) in craniopharyngiomas, tumors difficult to resect due to their anatomical location and critical surrounding structures.
Neurotoxic side effects have been reported in response to IFN\(\alpha\) immunotherapy68,69, leading researchers to propose additional immune vulnerabilities, such as IL-6 inhibition and immune checkpoint blockade, as cystic adamantinomatous craniopharyngiomas therapies70–74.
Our results support this endeavor.
Finally, we reproduced the overall known poor infiltration of CD8+ T cells and general low expression of CD274 (PD-L1) in pediatric brain tumors, highlighting that we urgently need novel therapeutic strategies for tumors unlikely to respond to immune checkpoint blockade therapy.
While large-scale collaborative efforts may take a longer time to complete, adoption an open science framework substantially mitigated this concern.
By maintaining all data, analytical code, and results in public repositories, we ensured that such logistics did not hinder progress in pediatric cancer research.
Indeed, OpenPBTA is already a foundational data analysis and processing layer for several discovery research and translational projects which will continue to add other genomic modalities and analyses, including germline, epigenomic, single-cell, splicing, imaging, and model drug response data.
For example, the OpenPBTA RNA fusion filtering module led to the development of the R package annoFuse75 and an R Shiny application shinyFuse.
Leveraging OpenPBTA’s medulloblastoma subtyping and immune deconvolution analyses, Dang and colleagues showed that SHH tumors are enriched with monocyte and microglia-derived macrophages, which may accumulate following radiation therapy9.
Expression and CNV analyses demonstrated that GPC2 is a highly expressed and copy-number gained immunotherapeutic target in ETMRs, medulloblastomas, choroid plexus carcinomas, H3 wildtype high-grade gliomas, and DMGs.
Foster and colleagues therefore developed a chimeric antigen receptor (CAR) directed against GPC2, which shows preclinical efficacy in mouse models11.
Another study harnessed OpenPBTA to integrate germline variants, discovering that pediatric HGG patients with alternative telomere lengthening are enriched for pathogenic or likely pathogenic germline variants in the MMR pathway, possess oncogenic ATRX mutations and have increased TMB12.
Moreover, OpenPBTA has enabled a framework to support real-time integration of clinical trial subjects as they enrolled on the PNOC008 high-grade glioma clinical trial76 or PNOC027 medulloblastoma clinical trial77, allowing researchers and clinicians to link tumor biology to translational impact through clinical decision support during tumor board discussions.
Finally, as part of the NCI’s CCDI, OpenPBTA was recently expanded into OpenPedCan, a pan-pediatric cancer effort (https://github.com/PediatricOpenTargets/OpenPedCan-analysis) which enabled creation of the pediatric Molecular Targets Platform (https://moleculartargets.ccdi.cancer.gov/) in support of the RACE Act.
An additional, large-scale cohort of >1,500 tumor samples and associated germline DNA is undergoing harmonization as part of CBTN CCDI-Kids First NCI and Common Fund project (https://commonfund.nih.gov/kidsfirst/2021X01projects#FY21_Resnick) and will be immediately integrated with OpenPBTA data through OpenPedCan.
OpenPBTA has paved the way for new modes of collaborative data-driven discovery using open, reproducible, and scalable analyses that will continue to grow over time.
We anticipate this foundational work will have an ongoing, long-term impact for pediatric oncology researchers, ultimately accelerating translation and leading to improved outcomes for children with cancer.
All code and processed data are openly available through GitHub, CAVATICA, Zenodo, and PedcBioPortal (see STAR METHODS).
Limitations of Study
Notably, PBTA brain tumor samples were collected over decades, and RNA samples were prepared using two distinct library preparations (stranded or poly-A, Figure S7A) by multiple sequencing centers.
While we noted a strong library preparation batch effect (Figure S7B) and a possible sequencing center batch effect (Figure S7C), cancer groups are highly unbalanced across library preparations (Figure S7A).
We did not perform batch correction because removing batch effects across unbalanced groups may induce false differences among groups78,79.
Instead, we circumvent batch effects by grouping only stranded RNA-Seq expression data, which comprises the vast majority of the PBTA cohort, for transcriptomic analyses presented in Figure 4 and Figure 5 .
As batch correction strategy depends highly on research goals79, we provide library preparation-specific expression matrices in the OpenPBTA data release for others to adapt to their needs.
A second potential limitation is that performing analyses with all samples, rather than samples with high tumor purity, might result in loss of information, such as subclonal variants or low-level oncogenic pathway expression.
To this end, we re-performed transcriptomic analyses using only samples with high tumor purity (see Methods for details), and indeed, results were broadly consistent with those derived from the full cohort (Figure S7D-I).
To enable more robust statistical analysis and presentation of results, we randomly selected one independent specimen from patients with duplicate sequenced samples per tumor event rather than combining the data.
This practice did not induce notable differences if the selected specimen changed over time, e.g., with a new data release.
Finally, because this initial PBTA cohort mostly contains samples collected at diagnosis from one tumor section/punch, we could not reliably perform systematic intratumoral and/or longitudinal analyses, though we expect nearly 100 paired longitudinal tumors from the (NIH X01 CA267587-01 pediatric brain tumor cohort) to be released through OpenPedCan for future exploration.
Acknowledgments
We graciously thank the patients and families who have donated tumors to CBTN and/or PNOC, without which this research would not be possible.
Philanthropic support has ensured the CBTN’s ability to collect, store, manage, and distribute specimen and data.
The following donors have provided leadership level support for CBTN: CBTN Executive Council members, Brain Tumor Board of Visitors, Children’s Brain Tumor Foundation, Easie Family Foundation, Kortney Rose Foundation, Lilabean Foundation, Minnick Family Charitable Fund, Perricelli Family, Psalm 103 Foundation, and Swifty Foundation.
This work was funded through the Alex’s Lemonade Stand Foundation (ALSF) Childhood Cancer Data Lab (CSG), ALSF Young Investigator Award (JLR), ALSF Catalyst Award (JLR, ACR, PBS), ALSF Catalyst Award (SJS), ALSF CCDL Postdoctoral Training Grant (SMF), Children’s Hospital of Philadelphia Division of Neurosurgery (PBS and ACR), Australian Government, Department of Education (APH), St. Anna Kinderkrebsforschung, Austria (ARP), the Mildred Scheel Early Career Center Dresden P2, funded by the German Cancer Aid (ARP), NIH Grants 3P30 CA016520-44S5 (ACR), U2C HL138346-03 (ACR, APH), U24 CA220457-03 (ACR), K12GM081259 (SMF), R03-CA23036 (SJD), NIH Contract Nos. HHSN261200800001E (SJD) and 75N91019D00024, Task Order No. 75N91020F00003 (JLR, ACR, APH), Intramural Research Program of the Division of Cancer Epidemiology and Genetics of the National Cancer Institute
The content of this publication does not necessarily reflect the views or policies of the Department of Health and Human Services, nor does mention of trade names, commercial products or organizations imply endorsement by the U.S. Government.
The authors thank the following collaborators who contributed or supervised analyses present in the analysis repository that were not included in the manuscript: William Amadio, Holly C. Beale, Ellen T. Kephart, A. Geoffrey Lyle, and Olena M. Vaske.
Finally, we thank Yuanchao Zhang for adding to the project codebase, Jessica B. Foster for helpful discussions while drafting the manuscript, and Gina D. Mawla for identifying and reporting OpenPBTA data issues.
Author Contributions
Author
Contributions
Joshua A. Shapiro
Methodology, Software, Validation, Formal analysis, Investigation, Writing - Original draft, Writing - Review and editing, Visualization, Supervision
Krutika S. Gaonkar
Data curation, Formal analysis, Investigation, Methodology, Software, Writing – Original draft, Writing - Review and editing
Stephanie J. Spielman
Validation, Formal analysis, Writing - Original draft, Writing - Review and editing, Investigation, Software, Visualization, Supervision, Funding acquisition
Candace L. Savonen
Methodology, Software, Validation, Formal analysis, Investigation, Writing - Original draft, Writing - Review and editing, Visualization
Chante J. Bethell
Methodology, Validation, Formal analysis, Investigation, Writing - Original draft, Visualization
Run Jin
Data curation, Formal analysis, Visualization, Writing – Original draft, Writing - Review and editing
Komal S. Rathi
Formal analysis, Investigation, Methodology, Writing – Original draft
Yuankun Zhu
Data curation, Formal analysis, Investigation, Methodology, Supervision
Laura E. Egolf
Formal analysis, Writing - Original draft
Bailey K. Farrow
Data curation, Software
Daniel P. Miller
Formal analysis
Yang Yang
Formal analysis, Software
Tejaswi Koganti
Formal analysis, Investigation
Nighat Noureen
Formal analysis, Visualization, Writing - Original draft
Mateusz P. Koptyra
Formal analysis, Writing – Original draft
Nhat Duong
Formal analysis, Investigation, Methodology
Mariarita Santi
Investigation, Validation, Writing - Review and editing
Conceptualization, Data curation, Formal analysis, Funding acquisition, Investigation, Methodology, Software, Supervision, Writing – Original draft, Writing - Review and editing
Jaclyn N. Taroni
Methodology, Software, Validation, Formal analysis, Investigation, Data curation, Writing - Review and editing, Visualization, Supervision, Project administration
Children’s Brain Tumor Network
Conceptualization
Pacific Pediatric Neuro-Oncology Consortium
Conceptualization
Except for the first and last four authors, authorship order was determined as follows: Authors who contributed to the OpenPBTA code base are listed based on number of modules included in the manuscript to which that individual contributed and, in the case of ties, a random order is used. All remaining authors are then listed in a random order.
Code for determining authorship order can be found in the count-contributions module of the OpenPBTA analysis repository.
Declarations of Interest
CSG’s spouse was an employee of Alex’s Lemonade Stand Foundation, which was a sponsor of this research.
JAS, CLS, CJB, SJS, and JNT are or were employees of Alex’s Lemonade Stand Foundation, a sponsor of this research.
AJW is a member of the Scientific Advisory boards for Alexion and DayOne Biopharmaceuticals.
Inclusion and Diversity
The CBTN worked to ensure gender and ethnic balance in the recruitment of human subjects and ensure sex balance in the selection of non-human subjects.
The CBTN worked to ensure diversity in experimental samples through the selection of both cell lines and genomic datasets.
One or more of the authors of this paper self-identifies as an under-represented ethnic minority in their field of research or within their geographical location.
One or more authors of this paper self-identifies as a gender minority in their field of research.
One or more of the authors of this paper self-identifies as a member of the LGBTQIA+ community.
One or more of the authors of this paper received support from a program designed to increase minority representation in science.
Figure Titles and Legends
Figure 1. Overview of the OpenPBTA Project.
A, CBTN and PNOC collected tumors from 943 patients. 22 tumor cell lines were created, and over 2000 specimens were sequenced (N = 1035 RNA-Seq, N = 940 WGS, and N = 32 WXS or targeted panel). The Kids First Data Resource Center Data harmonized the data using Amazon S3 through CAVATICA. Panel created with BioRender.com. B, Number of biospecimens across phases of therapy, with one broad histology per panel. Each bar denotes a cancer group. (Abbreviations: GNG = ganglioglioma, Other LGG = other low-grade glioma, PA = pilocytic astrocytoma, PXA = pleomorphic xanthoastrocytoma, SEGA = subependymal giant cell astrocytoma, DIPG = diffuse intrinsic pontine glioma, DMG = diffuse midline glioma, Other HGG = other high-grade glioma, ATRT = atypical teratoid rhabdoid tumor, MB = medulloblastoma, Other ET = other embryonal tumor, EPN = ependymoma, PNF = plexiform neurofibroma, DNET = dysembryoplastic neuroepithelial tumor, CRANIO = craniopharyngioma, EWS = Ewing sarcoma, CPP = choroid plexus papilloma). C, Overview of the open analysis and manuscript contribution models. Contributors proposed analyses, implemented it in their fork, and filed a pull request (PR) with proposed changes. PRs underwent review for scientific rigor and accuracy. Container and continuous integration technologies ensured that all software dependencies were included and code was not sensitive to underlying data changes. Finally, a contributor filed a PR documenting their methods and results to the Manubot-powered manuscript repository for review. D, A potential path for an analytical PR. Arrows indicate revisions.
Figure 2. Mutational landscape of PBTA tumors.
Frequencies of canonical somatic gene mutations, CNVs, fusions, and TMB (top bar plot) for the top mutated genes across primary tumors within the OpenPBTA dataset. A, LGGs (N = 226): pilocytic astrocytoma (N = 104), other LGG (N = 68), ganglioglioma (N = 35), pleomorphic xanthoastrocytoma (N = 9), subependymal giant cell astrocytoma (N = 10). B, Embryonal tumors (N = 129): medulloblastoma (N = 95), atypical teratoid rhabdoid tumor (N = 24), other embryonal tumor (N = 10). C, HGGs (N = 63): diffuse midline glioma (N = 36) and other HGG (N = 27). D, Other CNS tumors (N = 153): ependymoma (N = 60), craniopharyngioma (N = 31), meningioma (N = 17), dysembryoplastic neuroepithelial tumor (N = 19), Ewing sarcoma (N = 7), schwannoma (N = 12), and neurofibroma plexiform (N = 7). Rare CNS tumors are displayed in Figure S3B. Histology (Cancer Group) and sex annotations are displayed under each plot. Only tumors with mutations in the listed genes are shown. Multiple CNVs are denoted as a complex event. N denotes the number of unique tumors (one tumor per patient).
Figure 3. Mutational co-occurrence and signatures highlight key oncogenic drivers.
A, Nonsynonymous mutations for 50 most commonly-mutated genes across all histologies. “Other” denotes a histology with <10 tumors. B, Co-occurrence and mutual exclusivity of mutated genes. The co-occurrence score is defined as \(I(-\log_{10}(P))\) where \(P\) is Fisher’s exact test and \(I\) is 1 when mutations co-occur more often than expected or -1 when exclusivity is more common. C, Number of SV and CNV breaks are significantly correlated (Adjusted R = 0.443, p = 1.05e-38). D, Chromothripsis frequency across cancer groups with N >= 3 tumors. E, Sina plots of RefSig signature weights for signatures 1, 11, 18, 19, 3, 8, N6, MMR2, and Other across cancer groups. Boxplot represents 5% (lower whisker), 25% (lower box), 50% (median), 75% (upper box), and 95% (upper whisker) quantiles.
Figure 4. TP53 and telomerase activity
A, Receiver Operating Characteristic for TP53 classifier run on stranded FPKM RNA-Seq. B, Violin and strip plots of TP53 scores plotted by TP53 alteration type (Nactivated = 11, Nlost = 100, Nother = 866). C, Violin and strip plots of TP53 RNA expression plotted by TP53 activation status (Nactivated = 11, Nlost = 100, Nother = 866). D, Boxplots of TP53 and telomerase (EXTEND) scores across cancer groups. TMB status is highlighted in orange (hypermutant) or red (ultra-hypermutant). E, Heatmap of RefSig mutational signatures for patients with at least one hypermutant tumor or cell line. F, Forest plot depicting prognostic effects of TP53 and telomerase scores on overall survival (OS), controlling for extent of tumor resection, LGG group, and HGG group. G, Forest plot depicting the effect of molecular subtype on HGG OS. Hazard ratios (HR) with 95% confidence intervals and p-values (multivariate Cox) are given in F and G. Black diamonds denote significant p-values, and gray diamonds denote reference groups. H, Kaplan-Meier curve of HGGs by molecular subtype. Boxplot represents 5% (lower whisker), 25% (lower box), 50% (median), 75% (upper box), and 95% (upper whisker) quantiles.
Figure 5. Transcriptomic and immune landscape of pediatric brain tumors
A, First two dimensions of transcriptome data UMAP, with points colored by broad histology. B, Heatmap of GSVA scores for Hallmark gene sets with tumors ordered by cancer group. C, Boxplots of quanTIseq estimates of immune cell proportions in cancer groups with N > 15 tumors. Note: other HGGs and other LGGs have immune cell proportions similar to DMG and pilocytic astrocytoma, respectively, and are not shown. D, Forest plot depicting additive effects of CD274 expression, immune cell proportion, and extent of tumor resection on OS of medulloblastoma patients. HRs with 95% confidence intervals and p-values (multivariate Cox) are listed. Black diamonds denote significant p-values, and gray diamonds denote reference groups. Note: the Macrophage M1 HR was 0 (coefficient = -9.90e+4) with infinite upper and lower CIs, and thus was not included in the figure. E, Boxplot of CD274 expression (log2 FPKM) for medulloblastomas grouped by subtype. Bonferroni-corrected p-values from Wilcoxon tests are shown. Boxplot represents 5% (lower whisker), 25% (lower box), 50% (median), 75% (upper box), and 95% (upper whisker) quantiles. Only stranded RNA-Seq data is plotted.
Table Titles and Legends
Table 1. Molecular subtypes generated through the OpenPBTA project.
Broad tumor histologies, molecular subtypes generated, and number of patients and tumors subtyped within OpenPBTA.
Table 2. Patients with hypermutant tumors.
Patients with at least one hypermutant or ultra-hypermutant tumor or cell line. Pathogenic (P) or likely pathogenic (LP) germline variants, coding region TMB, phase of therapy, therapeutic interventions, cancer predisposition (CMMRD = Constitutional mismatch repair deficiency), and molecular subtypes are included.
STAR METHODS
RESOURCE AVAILABILITY
Lead contact
Requests for access to OpenPBTA raw data and/or specimens may be directed to, and will be fulfilled by Jo Lynne Rokita (rokita@chop.edu).
Any additional information required to reanalyze the data reported in this paper is available from the lead contact upon request.
Data releases
We maintained a data release folder on Amazon S3, downloadable directly from S3 or our open-access CAVATICA project, with merged files for each analysis (See Data and code availability section).
As we produced new results (e.g., tumor mutation burden calculations) that we expected to be used across multiple analyses, or identified data issues, we created new data releases in a versioned manner.
We reran all manuscript-specific analysis modules with the latest data release (v23) prior to submission and subsequently created a GitHub repository-tagged release to ensure reproducibility.
EXPERIMENTAL MODEL AND STUDY PARTICIPANT DETAILS
The Pediatric Brain Tumor Atlas specimens are comprised of samples from Children’s Brain Tumor Network (CBTN)4 and the Pediatric Pacific Neuro-Oncology Consortium (PNOC).
The CBTN is a collaborative, multi-institutional (32 institutions worldwide) research program dedicated to the study of childhood brain tumors.
PNOC is an international consortium dedicated to bringing new therapies to children and young adults with brain tumors.
We also include blood and tumor biospecimens from newly-diagnosed diffuse intrinsic pontine glioma (DIPG) patients as part of the PNOC003 clinical trial PNOC003/NCT0227498714.
Model generation
Previously, CBTN-generated cell lines were derived from either fresh tumor tissue directly obtained from surgery performed at Children’s Hospital of Philadelphia (CHOP) or from prospectively collected tumor specimens stored in Recover Cell Culture Freezing medium (cat# 12648010, Gibco).
Tumor tissue was dissociated using enzymatic method with papain as described13.
Briefly, we washed tissue with HBSS (cat# 14175095, Gibco), and tissue was minced and incubated with activated papain solution (cat# LS003124, SciQuest) for up to 45 minutes.
Ovomucoid solution (cat# 542000, SciQuest) was used to inactivate the papain, tissue was briefly treated tissue with DNase (cat# 10104159001, Roche) and passed through a 100μm cell strainer (cat# 542000, Greiner Bio-One).
Two cell culture conditions were initiated based on the number of cells available.
For cultures utilizing the fetal bovine serum (FBS), cells were plated a minimum density of 3×10⁵ cells/mL in DMEM/F-12 medium (cat# D8062, Sigma) supplemented with 20% FBS (cat# SH30910.03, Hyclone), 1% GlutaMAX (cat# 35050061, Gibco), Penicillin/Streptomycin-Amphotericin B Mixture (cat# 17-745E, Lonza), and 0.2% Normocin (cat# ant-nr-2, Invivogen).
For serum-free media conditions, cells were plated at minimum density of 1×10⁶ cells/mL in DMEM/F12 medium supplemented with 1% GlutaMAX, 1X B-27 supplement minus vitamin A (cat# 12587-010, Gibco), 1x N-2 supplement (cat# 17502001, Gibco), 20 ng/ml epidermal growth factor (cat# PHG0311L, Gibco), 20 ng/mL basic fibroblast growth factor (cat# 100-18B, PeproTech), 2.5μg/mL heparin (cat# H3149, Sigma), Penicillin/Streptomycin-Amphotericin B Mixture, and 0.2% Normocin.
All cell lines used for nucleic acid extraction were confirmed to be mycoplasma-free.
Guardian Forensic Sciences performed GenePrint 24 (cat# B1870, Promega), short tandem repeat (STR) analysis on cell line extracted DNA to both confirm identity and that they were free of cross-contamination.
Additionally, we performed NGSCheckMate82 on matched DNA and RNA cell line (tumor) and peripheral blood (normal) CRAM files to further confirm identity.
METHOD DETAILS
Nucleic acids extraction and library preparation
PNOC samples
The Translational Genomic Research Institute (TGEN; Phoenix, AZ) performed DNA and RNA extractions on tumor biopsies using a DNA/RNA AllPrep Kit (Qiagen, #80204).
All RNA used for library prep had a minimum RIN of seven, but no QC thresholds were implemented for the DNA.
For library preparation, 500 ng of nucleic acids were used as input for RNA-Seq, WXS, and targeted DNA panel (panel) sequencing.
RNA library preparation was performed using the TruSeq RNA Sample Prep Kit (Illumina, #FC-122-1001) with poly-A selection, and the exome prep was performed using KAPA Library Preparation Kit (Roche, #KK8201) using Agilent’s SureSelect Human All Exon V5 backbone with custom probes.
The targeted DNA panel developed by Ashion Analytics (formerly known as the GEM Cancer panel) consisted of exonic probes against 541 cancer genes.
Both panel and WXS assays contained 44,000 probes across evenly spaced genomic loci used for genome-wide copy number analysis.
For the panel, additional probes tiled across intronic regions of 22 known tumor suppressor genes and 22 genes involved in common cancer translocations for structural analysis.
All extractions and library preparations were performed according to manufacturer’s instructions.
CBTN samples
Blood, tissue, and cell line DNA/RNA extractions were performed at the Biorepository Core at CHOP.
Briefly, 10-20 mg frozen tissue, 0.4-1ml of blood, or 2e6 cells pellet was used for extractions.
Tissues were lysed using a Qiagen TissueLyser II (Qiagen) with 2×30 sec at 18Hz settings using 5 mm steel beads (cat# 69989, Qiagen).
Both tissue and cell pellets processes included a CHCl3 extraction and were run on the QIACube automated platform (Qiagen) using the AllPrep DNA/RNA/miRNA Universal kit (cat# 80224, Qiagen).
Blood was thawed and treated with RNase A (cat#, 19101, Qiagen); 0.4-1ml was processed using the Qiagen QIAsymphony automated platform (Qiagen) using the QIAsymphony DSP DNA Midi Kit (cat# 937255, Qiagen).
DNA and RNA quantity and quality was assessed by PerkinElmer DropletQuant UV-VIS spectrophotometer (PerkinElmer) and an Agilent 4200 TapeStation (Agilent, USA) for RIN and DIN (RNA Integrity Number and DNA Integrity Number, respectively).
The NantHealth Sequencing Center, BGI at CHOP, or the Genomic Clinical Core at Sidra Medical and Research Center performed library preparation and sequencing.
BGI at CHOP and Sidra Medical and Research Center used in house, center-specific workflows for sample preparation.
At NantHealth Sequencing Center, DNA sequencing libraries were prepared for tumor and matched-normal DNA using the KAPA HyperPrep kit (cat# 08098107702, Roche), and tumor RNA-Seq libraries were prepared using KAPA Stranded RNA-Seq with RiboErase kit (cat# 07962304001, Roche).
Data generation
NantHealth and Sidra performed 2x150 bp WGS on paired tumor (~60X) and constitutive DNA (~30X) samples on an Illumina X/400.
BGI at CHOP performed 2x100 bp WGS sequenced at 60X depth for both tumor and normal samples.
NantHealth performed ribosomal-depleted whole transcriptome stranded RNA-Seq to an average depth of 200M.
BGI at CHOP performed poly-A or ribosomal-depleted whole transcriptome stranded RNA-Seq to an average depth of 100M.
The Translational Genomic Research Institute (TGEN; Phoenix, AZ) performed paired tumor (~200X) and constitutive whole exome sequencing (WXS) or targeted DNA panel (panel) and poly-A selected RNA-Seq (~200M reads) for PNOC tumor samples.
The panel tumor sample was sequenced to 470X, and the normal panel sample was sequenced to 308X.
PNOC 2x100 bp WXS and RNA-Seq libraries were sequenced on an Illumina HiSeq 2500.
DNA WGS Alignment
We used BWA-MEM83 to align paired-end DNA-seq reads to the version 38 patch release 12 of the Homo sapiens genome reference, obtained as a FASTA file from UCSC (see Key Resources Table).
Next, we used the Broad Institute’s Best Practices84 to process Binary Alignment/Map files (BAMs) in preparation for variant discovery.
We marked duplicates using SAMBLASTER85, and we merged and sorted BAMs using Sambamba86
We used the BaseRecalibrator submodule of the Broad’s Genome Analysis Tool Kit GATK87 to process BAM files.
Lastly, for normal/germline input, we used the GATKHaplotypeCaller88 submodule on the recalibrated BAM to generate a genomic variant call format (GVCF) file.
This file is used as the basis for germline calling, described in the SNV calling for B-allele Frequency (BAF) generation section.
To confirm sample matches and remove mis-matched samples from the dataset, we performed NGSCheckMate82 on matched tumor/normal CRAM files.
Briefly, we processed CRAMs using BCFtools to filter and call 20k common single nucleotide polymorphisms (SNPs) using default parameters.
We used the resulting VCFs to run NGSCheckMate.
Per NGSCheckMate author recommendations, we used <= 0.61 as a correlation coefficient cutoff at sequencing depths > 10 to predict mis-matched samples.
We determined RNA-Seq read strandedness by running the infer_experiment.py script from RNA-SeQC89 on the first 200k mapped reads.
We removed any samples whose calculated strandedness did not match strandedness information provided by the sequencing center.
We required that at least 60% of RNA-Seq reads mapped to the human reference for samples to be included in analysis.
During OpenPBTA analysis, we identified some samples which were mis-identified or potentially swapped.
Through collaborative analyses and pathology review, these samples were removed from our data releases and from the Kids First portal.
Sample removal and associated justifications were documented in the OpenPBTA data release notes.
Germline Variant Calling
SNP calling for B-allele Frequency (BAF) generation
We performed germline haplotype calls using the GATK Joint Genotyping Workflow on individual GVCFs from the normal sample alignment workflow.
Using only SNPs, we applied the GATK generic hard filter suggestions to the VCF, with an additional requirement of 10 reads minimum depth per SNP.
We used the filtered VCF as input to Control-FREEC and CNVkit (below) to generate B-allele frequency (BAF) files.
This single-sample workflow is available in the D3b GitHub repository.
References can be obtained from the Broad Genome References on AWS bucket, and a general description of references can be found at https://s3.amazonaws.com/broad-references/broad-references-readme.html.
Assessment of germline variant pathogenicity
For patients with hypermutant samples, we first added population frequency of germline variants using ANNOVAR90 and pathogenicity scoring from ClinVar91 using SnpSift92.
We then filtered for variants with read depth >= 15, variant allele fraction >= 0.20, and which were observed at < 0.1% allele frequency across each population in the Genome Aggregation Database (see Key Resources Table).
Finally, we retained variants in genes included in the KEGG MMR gene set (see Key Resources Table), POLE, and/or TP53 which were ClinVar-annotated as pathogenic (P) or likely pathogenic (LP) with review status of >= 2 stars.
All P/LP variants were manually reviewed by an interdisciplinary team of scientists, clinicians, and genetic counselors.
This workflow is available in the D3b GitHub repository.
Somatic Mutation Calling
SNV and indel calling
We used four variant callers to call SNVs and indels from paired tumor/normal samples with Targeted Panel, WXS, and/or WGS data: Strelka293, Mutect294, Lancet95, and VarDictJava96.
VarDictJava-only calls were not retained since ~ 39M calls with low VAF were uniquely called and may be potential false positives. (~1.2M calls were called by Mutect2, Strelka2, and Lancet and included consensus CNV calling as described below.)
We used only Strelka2, Mutect2 and Lancet to analyze WXS samples from TCGA.
TCGA samples were captured using various WXS target capture kits and we downloaded the BED files from the GDC portal.
The manufacturers provided the input interval BED files for both panel and WXS data for PBTA samples.
We padded all panel and WXS BED files were by 100 bp on each side for Strelka2, Mutect2, and VarDictJava runs and by 400 bp for the Lancet run.
For WGS calling, we utilized the non-padded BROAD Institute interval calling list wgs_calling_regions.hg38.interval_list, comprised of the full genome minus N bases, unless otherwise noted below.
We ran Strelka293 using default parameters for canonical chromosomes (chr1-22, X,Y,M), as recommended by the authors, and we filtered the final Strelka2 VCF for PASS variants.
We ran Mutect2 from GATK according to Broad best practices outlined from their Workflow Description Language (WDL), and we filtered the final Mutect2 VCF for PASS variants.
To manage memory issues, we ran VarDictJava96 using 20 Kb interval chunks of the input BED, padded by 100 bp on each side, such that if an indel occurred in between intervals, it would be captured.
Parameters and filtering followed BCBIO standards except that variants with a variant allele frequency (VAF) >= 0.05 (instead of >= 0.10) were retained.
The 0.05 VAF increased the true positive rate for indels and decreased the false positive rate for SNVs when using VarDictJava in consensus calling.
We filtered the final VarDictJava VCF for PASS variants with TYPE=StronglySomatic.
We ran Lancet using default parameters, except for those noted below.
For input intervals to Lancet WGS, we created a reference BED from only the UTR, exome, and start/stop codon features of the GENCODE 31 reference, augmented as recommended with PASS variant calls from Strelka2 and Mutect2.
We then padded these intervals by 300 bp on each side during Lancet variant calling.
Per recommendations for WGS samples, we augmented the Lancet input intervals described above with PASS variant calls from Strelka2 and Mutect2 as validation97.
VCF annotation and MAF creation
We normalized INDELs with bcftools norm on all PASS VCFs using the kfdrc_annot_vcf_sub_wf.cwl subworkflow, release v3 (See Table S5).
The Ensembl Variant Effect Predictor (VEP)98, reference release 93, was used to annotate variants and bcftools was used to add population allele frequency (AF) from gnomAD99.
We annotated SNV and INDEL hotspots from v2 of Memorial Sloan Kettering Cancer Center’s (MSKCC) database (See Key Resources Table) as well as the TERT promoter mutations C228T and C250T100.
We annotated SNVs by matching amino acid position (Protein_position column in MAF file) with SNVs in the MSKCC database, we matched splice sites to HGVSp_Short values in the MSKCC database, and we matched INDELs based on amino acid present within the range of INDEL hotspots values in the MSKCC database.
We removed non-hotspot annotated variants with a normal depth less than or equal to 7 and/or gnomAD allele frequency (AF) greater than 0.001 as potential germline variants.
We matched TERT promoter mutations using hg38 coordinates as indicated in ref.100: C228T occurs at 5:1295113 is annotated as existing variant s1242535815, COSM1716563, or COSM1716558, and is 66 bp away from the TSS; C250T occurs at Chr5:1295135, is annotated as existing variant COSM1716559, and is 88 bp away from the TSS.
We retained variants annotated as PASS or HotSpotAllele=1 in the final set, and we created MAFs using MSKCC’s vcf2maf tool.
Gather SNV and INDEL Hotspots
We retained all variant calls from Strelka2, Mutect2, or Lancet that overlapped with an SNV or INDEL hotspot in a hotspot-specific MAF file, which we then used for select analyses as described below.
Consensus SNV Calling
Our SNV calling process led to separate sets of predicted mutations for each caller.
We considered mutations to describe the same change if they were identical for the following MAF fields: Chromosome, Start_Position, Reference_Allele, Allele, and Tumor_Sample_Barcode.
Strelka2 does not call multinucleotide variants (MNV), but instead calls each component SNV as a separate mutation, so we separated MNV calls from Mutect2 and Lancet into consecutive SNVs before comparing them to Strelka2 calls.
We examined VAFs produced by each caller and compared their overlap with each other (Figure S2).
VarDictJava calls included many variants that were not identified by other callers (Figure S2C), while the other callers produced results that were relatively consistent with one another.
Many of these VarDictJava-specific calls were variants with low allele frequency (Figure S2B).
We therefore derived consensus mutation calls as those shared among the other three callers (Strelka2, Mutect2, and Lancet), and we did not further consider VarDictJava calls due to concerns it called a large number of false positives.
This decision had minimal impact on results because VarDictJava also identified nearly every mutation that the other three callers identified, in addition to many unique mutations.
Somatic Copy Number Variant Calling (WGS samples only)
We used Control-FREEC101,102 and CNVkit103 for copy number variant calls.
For both algorithms, the germline_sex_estimate (described below) was used as input for sample sex and germline variant calls (above) were used as input for BAF estimation.
Control-FREEC was run on human genome reference hg38 using the optional parameters of a 0.05 coefficient of variation, ploidy choice of 2-4, and BAF adjustment for tumor-normal pairs.
Theta2104 used VarDictJava germline and somatic calls, filtered on PASS and strongly somatic, to infer tumor purity.
Theta2 purity was added as an optional parameter to CNVkit to adjust copy number calls.
CNVkit was run on human genome reference hg38 using the optional parameters of Theta2 purity and BAF adjustment for tumor-normal pairs.
We used GISTIC105 on the CNVkit and the consensus CNV segmentation files to generate gene-level copy number abundance (Log R Ratio) as well as chromosomal arm copy number alterations using the parameters specified in the (run-gistic analysis module in the OpenPBTA Analysis repository).
Consensus CNV Calling
For each caller and sample, we called CNVs based on consensus among Control-FREEC101,102, CNVkit103, and Manta106.
We specifically included CNVs called significant by Control-FREEC (p-value < 0.01) and Manta calls that passed all filters in consensus calling.
We removed sample and consensus caller files with more than 2,500 CNVs because we expected these to be noisy and derive poor quality samples based on cutoffs used in GISTIC105.
For each sample, we included the regions in the final consensus set: 1) regions with reciprocal overlap of 50% or more between at least two of the callers; 2) smaller CNV regions in which more than 90% of regions are covered by another caller.
We did not include any copy number alteration called by a single algorithm in the consensus file.
We defined copy number as NA for any regions that had a neutral call for the samples included in the consensus file.
We merged CNV regions within 10,000 bp of each other with the same direction of gain or loss into single region.
We filtered out any CNVs that overlapped 50% or more with immunoglobulin, telomeric, centromeric, segment duplicated regions, or that were shorter than 3000 bp.
We used Manta106 for structural variant (SV) calls, and we limited to regions used in Strelka2.
The hg38 reference for SV calling used was limited to canonical chromosome regions.
We used AnnotSV107 to annotate Manta output.
All associated workflows are available in the workflows GitHub repository.
Gene Expression
Abundance Estimation
We used STAR108 to align paired-end RNA-seq reads, and we used the associated alignment for all subsequent RNA analysis.
We used Ensembl GENCODE 27 “Comprehensive gene annotation” (see Key Resources Table) as a reference.
We used RSEM109 for both FPKM and TPM transcript- and gene-level quantification.
Gene Expression Matrices with Unique HUGO Symbols
To enable downstream analyses, we next identified gene symbols that map to multiple Ensembl gene identifiers (in GENCODE v27, 212 gene symbols map to 1866 Ensembl gene identifiers), known as multi-mapped gene symbols, and ensured unique mappings (collapse-rnaseq analysis module in the OpenPBTA Analysis repository).
To this end, we first removed genes with no expression from the RSEM abundance data by requiring an FPKM > 0 in at least 1 sample across the PBTA cohort.
We computed the mean FPKM across all samples per gene.
For each multi-mapped gene symbol, we chose the Ensembl identifier corresponding to the maximum mean FPKM, using the assumption that the gene identifier with the highest expression best represented the expression of the gene.
After collapsing gene identifiers, 46,400 uniquely-expressed genes remained in the poly-A dataset, and 53,011 uniquely-expressed genes remained in the stranded dataset.
Gene fusion detection
We set up Arriba110 and STAR-Fusion111 fusion detection tools using CWL on CAVATICA.
For both of these tools, we used aligned BAM and chimeric SAM files from STAR as inputs and GRCh38_gencode_v27 GTF for gene annotation.
We ran STAR-Fusion with default parameters and annotated all fusion calls with the GRCh38_v27_CTAT_lib_Feb092018.plug-n-play.tar.gz file from the STAR-Fusion release.
For Arriba, we used a blacklist file blacklist_hg38_GRCh38_2018-11-04.tsv.gz from the Arriba release to remove recurrent fusion artifacts and transcripts present in healthy tissue.
We provided Arriba with strandedness information for stranded samples, or we set it to auto-detection for poly-A samples.
We used FusionAnnotator on Arriba fusion calls to harmonize annotations with those of STAR-Fusion.
The RNA expression and fusion workflows can be found in the D3b GitHub repository.
The FusionAnnotator workflow we used for this analysis can be found in the D3b GitHub repository.
QUANTIFICATION AND STATISTICAL ANALYSIS
All p-values are two-sided unless otherwise stated.
Z-scores were calculated using the formula \(z=(x –\mu)/\sigma\) where \(x\) is the value of interest, \(\mu\) is the mean, and \(\sigma\) is the standard deviation.
Tumor purity (tumor-purity-exploration module)
Estimating tumor fraction from RNA directly is challenging because most assume tumor cells comprise all non-immune cells112, which is not a valid assumption for many diagnoses in the PBTA cohort.
We therefore used Theta2 (as described in the “Somatic Copy Number Variant Calling section” Methods section) to infer tumor purity from WGS samples, further assuming that co-extracted RNA and DNA samples had the same tumor purity.
We then created a set of stranded RNA-Seq data thresholded by median tumor purity of the cancer group to rerun selected transcriptomic analyses: telomerase-activity-prediction, tp53_nf1_score, transcriptomic-dimension-reduction, immune-deconv, and gene-set-enrichment-analysis.
Note that these thresholded analyses, which only considered stranded RNA samples that also had co-extracted DNA, were performed in their respective OpenPBTA analyses modules (not within tumor-purity-exploration).
Recurrently mutated genes and co-occurrence of gene mutations (interaction-plots analysis module)
Using the consensus SNV calls, we identified genes that were recurrently mutated in the OpenPBTA cohort, including nonsynonymous mutations with a VAF > 5% among the set of independent samples.
We used VEP98 annotations, including “High” and “Moderate” consequence types as defined in the R package Maftools113, to determine the set of nonsynonymous mutations.
For each gene, we then tallied the number of samples that had at least one nonsynonymous mutation.
For genes that contained nonsynonymous mutations in multiple samples, we calculated pairwise mutation co-occurrence scores.
This score was defined as \(I(-\log_{10}(P))\) where \(I\) is 1 when the odds ratio is > 1 (indicating co-occurrence), and -1 when the odds ratio is < 1 (indicating mutual exclusivity), with \(P\) defined by Fisher’s Exact Test.
Focal Copy Number Calling (focal-cn-file-preparation analysis module)
We added the ploidy inferred via Control-FREEC to the consensus CNV segmentation file and used the ploidy and copy number values to define gain and loss values broadly at the chromosome level.
We used bedtools coverage114 to add cytoband status using the UCSC cytoband file115 (See Key Resources Table).
The output status call fractions, which are values of the loss, gain, and callable fractions of each cytoband region, were used to define dominant status at the cytoband-level.
We calculated the weighted means of each status call fraction using band length.
We used the weighted means to define the dominant status at the chromosome arm-level.
A status was considered dominant if more than half of the region was callable and the status call fraction was greater than 0.9 for that region.
We adopted this 0.9 threshold to ensure that the dominant status fraction call was greater than the remaining status fraction calls in a region.
We aimed to define focal copy number units to avoid calling adjacent genes in the same cytoband or arm as copy number losses or gains where it would be more appropriate to call the broader region a loss or gain.
To determine the most focal units, we first considered the dominant status calls at the chromosome arm-level.
If the chromosome arm dominant status was callable but not clearly defined as a gain or loss, we instead included the cytoband-level status call.
Similarly, if a cytoband dominant status call was callable but not clearly defined as a gain or loss, we instead included gene-level status call.
To obtain the gene-level data, we used the IRanges package in R116 to find overlaps between the segments in the consensus CNV file and the exons in the GENCODE v27 annotation file (See Key Resources Table) .
If the copy number value was 0, we set the status to “deep deletion”.
For autosomes only, we set the status to “amplification” when the copy number value was greater than two times the ploidy value.
We plotted genome-wide gains and losses in (Figure S3C) using the R package ComplexHeatmap117.
Breakpoint Density (WGS samples only; chromosomal-instability analysis module)
We defined breakpoint density as the number of breaks per genome or exome per sample.
For Manta SV calls, we filtered to retain “PASS” variants and used breakpoints from the algorithm.
For consensus CNV calls, if |log2 ratio| > log2(1), we annotated the segment as a break.
We then calculated breakpoint density as:
\[\textrm{breakpoint density} = \frac{\textrm{N breaks}}{\textrm{Size in Mb of }\textit{effectively surveyed} \textrm{ genome}}\]
Considering only chromosomes 1-22 and X, we identified candidate chromothripsis regions in the set of independent tumor WGS samples with ShatterSeek118, using Manta SV calls that passed all filters and consensus CNV calls.
We modified the consensus CNV data to fit ShatterSeek input requirements as follows: we set CNV-neutral or excluded regions as the respective sample’s ploidy value from Control-FREEC, and we then merged consecutive segments with the same copy number value.
We classified candidate chromothripsis regions as high- or low-confidence using the statistical criteria described by the ShatterSeek authors.
Immune Profiling and Deconvolution (immune-deconv analysis module)
We used the R package immunedeconv119 with the method quanTIseq120 to deconvolute various immune cell types in tumors using collapsed FPKM RNA-seq, with samples batched by library type and then combined.
The quanTIseq deconvolution method directly estimates absolute fractions of 10 immune cell types that represent inferred proportions of the cell types in the mixture.
Therefore, we utilized quanTIseq for inter-sample, intra-sample, and inter-histology score comparisons.
Gene Set Variation Analysis (gene-set-enrichment-analysis analysis module)
We performed Gene Set Variation Analysis (GSVA) on collapsed, log2-transformed RSEM FPKM data for stranded RNA-Seq samples using the GSVA Bioconductor package121.
We specified the parameter mx.diff=TRUE to obtain Gaussian-distributed scores for each of the MSigDB hallmark gene sets122.
We compared GSVA scores among histology groups using ANOVA and subsequent Tukey tests; p-values were Bonferroni-corrected for multiple hypothesis testing.
We plotted scores by cancer group using the ComplexHeatmap R package (Figure 5B)117.
We applied Uniform Manifold Approximation and Projection (UMAP)123 to log2-transformed FPKM data for stranded RNA-Seq samples using the umap R package (See Key Resources Table).
We considered all stranded RNA-Seq samples for this analysis, but we removed genes whose FPKM sum across samples was less than 100.
We set the UMAP number of neighbors parameter to 15.
We performed artifact filtering and additional annotation on fusion calls to prioritize putative oncogenic fusions.
Briefly, we considered all in-frame and frameshift fusion calls with at least one junction read and at least one gene partner expressed (TPM > 1) to be true calls.
If a fusion call had a large number of spanning fragment reads compared to junction reads (spanning fragment minus junction read greater than ten), we removed these calls as potential false positives.
We prioritized a union of fusion calls as true calls if the fused genes were detected by both callers, the same fusion was recurrent within a broad histology grouping (> 2 samples), or the fusion was specific to the given broad histology.
If either 5’ or 3’ genes fused to more than five different genes within a sample, we removed these calls as potential false positives.
We annotated putative driver fusions and prioritized fusions based on partners containing known kinases, oncogenes, tumor suppressors, curated transcription factors124, COSMIC genes, and/or known TCGA fusions from curated references.
Based on pediatric cancer literature review, we added MYBL1125, SNCAIP126, FOXR2127, TTYH1128, and TERT129–132 to the oncogene list, and we added BCOR127 and QKI133 to the tumor suppressor gene list.
We used Maftools113 to generate oncoprints depicting the frequencies of canonical somatic gene mutations, CNVs, and fusions for the top 20 genes mutated across primary tumors within broad histologies of the OpenPBTA dataset.
We collated canonical genes from the literature for low-grade gliomas (LGGs)25, embryonal tumors26,28,29,134,135, high-grade gliomas (HGGs)14,31,32,136, and other tumors: ependymomas, craniopharyngiomas, neuronal-glial mixed tumors, histiocytic tumors, chordoma, meningioma, and choroid plexus tumors33,137–145.
We obtained weights (i.e., exposures) for signature sets using the deconstructSigs R package function whichSignatures()146 from consensus SNVs with the BSgenome.Hsapiens.UCSC.hg38 annotations (see Key Resources Table).
Specifically, we estimated signature weights across samples for eight signatures previously identified in the Signal reference set of signatures (“RefSig”) as associated with adult central nervous system (CNS) tumors41.
These eight RefSig signatures are 1, 3, 8, 11, 18, 19, N6, and MMR2.
Weights for signatures fall in the range zero to one inclusive.
deconstructSigs estimates the weights for each signature across samples and allows for a proportion of unassigned weights referred to as “Other” in the text.
These results do not include signatures with small contributions; deconstructSigs drops signature weights that are less than 6%146.
We plotted mutational signatures for patients with hypermutant tumors (Figure 4E) using the R package ComplexHeatmap117.
We consider tumor mutation burden (TMB) to be the number of consensus SNVs per effectively surveyed base of the genome.
We considered base pairs to be effectively surveyed if they were in the intersection of the genomic ranges considered by the callers used to generate the consensus and where appropriate, regions of interest, such as coding sequences.
We calculated TMB as:
\[\textrm{TMB} = \frac{\textrm{# of coding sequence SNVs}}{\textrm{Size in Mb of }\textit{effectively surveyed} \textrm{ genome} }\]
We used the total number coding sequence consensus SNVs for the numerator and the size of the intersection of the regions considered by Strelka2 and Mutect2 with coding regions (CDS from GENCODE v27 annotation, see Key Resources Table) as the denominator.
Clinical Data Harmonization
WHO Classification of Disease Types
Table S1 contains a README, along with sample technical, clinical, and additional metadata used for this study.
Molecular Subtyping
We performed molecular subtyping on tumors in the OpenPBTA to the extent possible.
The molecular_subtype field in pbta-histologies.tsv contains molecular subtypes for tumor types selected from pathology_diagnosis and pathology_free_text_diagnosis fields as described below, following World Health Organization 2016 classification criteria20.
We further categorized broad tumor histologies into smaller groupings we denote “cancer groups.”
Medulloblastoma (MB) subtypes SHH, WNT, Group 3, and Group 4 were predicted using the consensus of two RNA expression classifiers: MedulloClassifier22 and MM2S23 on the RSEM FPKM data (molecular-subtyping-MB analysis module).
The 43 “true positive” subtypes were manually curated from pathology reports by two independent reviewers.
High-grade glioma (HGG) subtypes were derived (molecular-subtyping-HGG analysis module) using the following criteria:
If any sample contained an H3F3A p.K28M, HIST1H3B p.K28M, HIST1H3C p.K28M, or HIST2H3C p.K28M mutation and no BRAF p.V600E mutation, it was subtyped as DMG, H3 K28.
If any sample contained an HIST1H3B p.K28M, HIST1H3C p.K28M, or HIST2H3C p.K28M mutation and a BRAF p.V600E mutation, it was subtyped as DMG, H3 K28, BRAF V600E.
If any sample contained an H3F3A p.G35V or p.G35R mutation, it was subtyped asHGG, H3 G35.
If any high-grade glioma sample contained an IDH1 p.R132 mutation, it was subtyped as HGG, IDH.
If a sample was initially classified as HGG, had no defining histone mutations, and a BRAF p.V600E mutation, it was subtyped as BRAF V600E.
All other high-grade glioma samples that did not meet any of these criteria were subtyped as HGG, H3 wildtype.
Embryonal tumors were included in non-MB and non-ATRT embryonal tumor subtyping (molecular-subtyping-embryonal analysis module) if they met any of the following criteria:
A TTYH1 (5’ partner) fusion was detected.
A MN1 (5’ partner) fusion was detected, with the exception of MN1::PATZ1 since it is an entity separate of CNS HGNET-MN1 tumors147.
Pathology diagnoses included “Supratentorial or Spinal Cord PNET” or “Embryonal Tumor with Multilayered Rosettes”.
A pathology diagnosis of “Neuroblastoma”, where the tumor was not indicated to be peripheral or metastatic and was located in the CNS.
Any sample with “embryonal tumor with multilayer rosettes, ros (who grade iv)”, “embryonal tumor, nos, congenital type”, “ependymoblastoma” or “medulloepithelioma” in pathology free text.
Non-MB and non-ATRT embryonal tumors identified with the above criteria were further subtyped (molecular-subtyping-embryonal analysis module) using the criteria below148–151.
Any RNA-seq biospecimen with LIN28A overexpression, plus a TYH1 fusion (5’ partner) with a gene adjacent or within the C19MC miRNA cluster and/or copy number amplification of the C19MC region was subtyped as ETMR, C19MC-altered (Embryonal tumor with multilayer rosettes, chromosome 19 miRNA cluster altered)128,152.
Any RNA-seq biospecimen with LIN28A overexpression, a TTYH1 fusion (5’ partner) with a gene adjacent or within the C19MC miRNA cluster but no evidence of copy number amplification of the C19MC region was subtyped as ETMR, NOS (Embryonal tumor with multilayer rosettes, not otherwise specified)128,152.
Any RNA-seq biospecimen with a fusion having a 5’ MN1 and 3’ BEND2 or CXXC5 partner were subtyped as CNS HGNET-MN1 [Central nervous system (CNS) high-grade neuroepithelial tumor with MN1 alteration].
Non-MB and non-ATRT embryonal tumors with internal tandem duplication (as defined in153) of BCOR were subtyped as CNS HGNET-BCOR (CNS high-grade neuroepithelial tumor with BCOR alteration).
Non-MB and non-ATRT embryonal tumors with over-expression and/or gene fusions in FOXR2 were subtyped as CNS NB-FOXR2 (CNS neuroblastoma with FOXR2 activation).
Non-MB and non-ATRT embryonal tumors with CIC::NUTM1 or other CIC fusions, were subtyped as CNS EFT-CIC (CNS Ewing sarcoma family tumor with CIC alteration)127
Non-MB and non-ATRT embryonal tumors that did not fit any of the above categories were subtyped as CNS Embryonal, NOS (CNS Embryonal tumor, not otherwise specified).
Neurocytoma subtypes central neurocytoma (CNC) and extraventricular neurocytoma (EVN) were assigned (molecular-subtyping-neurocytoma analysis module) based on the primary site of the tumor154.
If the tumor’s primary site was “ventricles,” we assigned the subtype as CNC; otherwise, we assigned the subtype as EVN.
Craniopharyngiomas (CRANIO) were subtyped (molecular-subtyping-CRANIO analysis module) into adamantinomatous (CRANIO, ADAM), papillary (CRANIO, PAP) or undetermined (CRANIO, To be classified) based on the following criteria155,156:
Craniopharyngiomas from patients over 40 years old with a BRAF p.V600E mutation were subtyped as CRANIO, PAP.
Craniopharyngiomas from patients younger than 40 years old with mutations in exon 3 of CTNNB1 were subtyped as CRANIO, ADAM.
Craniopharyngiomas that did not fall into the above two categories were subtyped as CRANIO, To be classified.
A molecular subtype of EWS was assigned to any tumor with a EWSR1 fusion or with a pathology_diagnosis of Ewings Sarcoma (molecular-subtyping-EWS analysis module).
LGG or glialneuronal tumors (GNT) were subtyped (molecular-subtyping-LGAT analysis module) based on SNV, fusion, and CNV status based on21 and as described below.
If a sample contained a NF1 somatic mutation, either nonsense or missense, it was subtyped as LGG, NF1-somatic.
If a sample contained NF1 germline mutation, as indicated by a patient having the neurofibromatosis cancer predisposition, it was subtyped as LGG, NF1-germline.
If a sample contained the IDH p.R132 mutation, it was subtyped as LGG, IDH.
If a sample contained a histone p.K28M mutation in either H3F3A, H3F3B, HIST1H3B, HIST1H3C, or HIST2H3C, or if it contained a p.G35R or p.G35V mutation in H3F3A, it was subtyped as LGG, H3.
If a sample contained BRAF p.V600E or any other non-canonical BRAF mutations in the kinase (PK_Tyr_Ser-Thr) domain PF07714 (see Key Resources Table), it was subtyped as LGG, BRAF V600E.
If a sample contained KIAA1549::BRAF fusion, it was subtyped as LGG, KIAA1549::BRAF.
If a sample contained SNV or indel in either KRAS, NRAS, HRAS, MAP2K1, MAP2K2, MAP2K1, ARAF, RAF1, or non-kinase domain of BRAF, or if it contained RAF1 fusion, or BRAF fusion that was not KIAA1549::BRAF, it was subtyped as LGG, other MAPK.
If a sample contained SNV in either MET, KIT or PDGFRA, or if it contained fusion in ALK, ROS1, NTRK1, NTRK2, NTRK3 or PDGFRA, it was subtyped as LGG, RTK.
If a sample contained FGFR1 p.N546K, p.K656E, p.N577, or p. K687 hotspot mutations, or tyrosine kinase domain tandem duplication (See Key Resources Table), or FGFR1 or FGFR2 fusions, it was subtyped as LGG, FGFR.
If a sample contained MYB or MYBL1 fusion, it was subtyped as LGG, MYB/MYBL1.
If a sample contained focal CDKN2A and/or CDKN2B deletion, it was subtyped as LGG, CDKN2A/B.
For LGG tumors that did not have any of the above molecular alterations, if both RNA and DNA samples were available, it was subtyped as LGG, wildtype.
Otherwise, if either RNA or DNA sample was unavailable, it was subtyped as LGG, To be classified.
If pathology diagnosis was Subependymal Giant Cell Astrocytoma (SEGA), the LGG portion of molecular subtype was recoded to SEGA.
Lastly, for all LGG- and GNT- subtyped samples, if the tumors were glialneuronal in origin, based on pathology_free_text_diagnosis entries of desmoplastic infantile,desmoplastic infantile ganglioglioma, desmoplastic infantile astrocytoma or glioneuronal, each was recoded as follows:
If pathology diagnosis is Low-grade glioma/astrocytoma (WHO grade I/II) or Ganglioglioma, the LGG portion of the molecular subtype was recoded to GNT.
Ependymomas (EPN) were subtyped (molecular-subtyping-EPN analysis module) into EPN, ST RELA, EPN, ST YAP1, EPN, PF A and EPN, PF B based on evidence for these molecular subgroups as described in Pajtler et al.138.
Briefly, fusion, CNV and gene expression data were used to subtype EPN as follows:
Any tumor with fusions containing RELA as fusion partner, e.g., C11orf95::RELA, LTBP3::RELA, was subtyped as EPN, ST RELA.
Any tumor with fusions containing YAP1 as fusion partner, such as C11orf95::YAP1, YAP1::MAMLD1 and YAP1::FAM118B, was subtyped as EPN, ST YAP1.
Any tumor with the following molecular characterization would be subtyped as EPN, PF A:
CXorf67 expression z-score of over 3
TKTL1 expression z-score of over 3 and 1q gain
Any tumor with the following molecular characterization would be subtyped as EPN, PF B:
GPBP17 expression z-score of over 3 and loss of 6q or 6p
IFT46 expression z-score of over 3 and loss of 6q or 6p
Any tumor with the above molecular characteristics would be exclusively subtyped to the designated group.
For all other remaining EPN tumors without above molecular characteristics, they would be subtyped to EPN, ST RELA and EPN, ST YAP1 in a non-exclusive way (e.g., a tumor could have both EPN, ST RELA and EPN, ST YAP1 subtypes) if any of the following alterations were present.
Any tumor with the following alterations was assigned EPN, ST RELA:
PTEN::TAS2R1 fusion
chromosome 9 arm (9p or 9q) loss
RELA expression z-score of over 3
L1CAM expression z-score of over 3
Any tumor with the following alterations was assigned EPN, ST YAP1:
C11orf95::MAML2 fusion
chromosome 11 short arm (11p) loss
chromosome 11 long arm (11q) gain
ARL4D expression z-score of over 3
CLDN1 expression z-score of over 3
After all relevant tumor samples were subtyped by the above molecular subtyping modules, the results from these modules, along with other clinical information (such as pathology diagnosis free text), were compiled in the molecular-subtyping-pathology module and integrated into the OpenPBTA data in the molecular-subtyping-integrate module.
We annotated TP53 altered HGG samples as either TP53 lost or TP53 activated and integrated this within the molecular subtype.
To this end, we applied a TP53 inactivation classifier originally trained on TCGA pan-cancer data43 to the matched RNA expression data, with samples batched by library type.
Along with the TP53 classifier scores, we collectively used consensus SNV and CNV, SV, and reference databases that list TP53 hotspot mutations157,158 and functional domains159 to determine TP53 alteration status for each sample.
We adopted the following rules for calling either TP53 lost or TP53 activated:
If a sample had either of the two well-characterized TP53 gain-of-function mutations, p.R273C or p.R248W44, we assigned TP53 activated status.
Samples were annotated as TP53 lost if they contained i) a TP53 hotspot mutation as defined by IARC TP53 database or the MSKCC cancer hotspots database157,158 (see also, Key Resources Table), ii) two TP53 alterations, including SNV, CNV or SV, indicative of probable bi-allelic alterations; iii) one TP53 somatic alteration, including SNV, CNV, or SV or a germline TP53 mutation indicated by the diagnosis of Li-Fraumeni syndrome (LFS)160, or iv) one germline TP53 mutation indicated by LFS and the TP53 classifier score for matched RNA-Seq was greater than 0.5.
Prediction of participants’ genetic sex
Participant metadata included a reported gender.
We used WGS germline data, in concert with the reported gender, to predict participant genetic sex so that we could identify sexually dimorphic outcomes.
This analysis may also indicate samples that may have been contaminated.
We used the idxstats utility from SAMtools161 to calculate read lengths, the number of mapped reads, and the corresponding chromosomal location for reads to the X and Y chromosomes.
We used the fraction of total normalized X and Y chromosome reads that were attributed to the Y chromosome as a summary statistic.
We manually reviewed this statistic in the context of reported gender and determined that a threshold of less than 0.2 clearly delineated female samples.
We marked fractions greater than 0.4 as predicted males, and we marked samples with values in the inclusive range 0.2-0.4 as unknown.
We performed this analysis through CWL on CAVATICA.
We added resulting calls to the histologies file under the column header germline_sex_estimate.
Selection of independent samples (independent-samples analysis module)
Certain analyses required that we select only a single representative specimen for each individual.
In these cases, we identified a single specimen by prioritizing primary tumors and those with whole-genome sequencing available.
If this filtering still resulted in multiple specimens, we randomly selected a single specimen from the remaining set.
Quantification of Telomerase Activity using Gene Expression Data (telomerase-activity-prediction analysis module)
We predicted telomerase activity of tumor samples using the recently developed EXTEND method45, with samples batched by library type.
Briefly, EXTEND estimates telomerase activity based on the expression of a 13-gene signature.
We derived this signature by comparing telomerase-positive tumors and tumors with activated alternative lengthening of telomeres pathway, a group presumably negative of telomerase activity.
We calculated overall survival (OS) as days since initial diagnosis and performed several survival analyses on the OpenPBTA cohort using the survival R package.
We performed survival analysis for patients by HGG subtype using the Kaplan-Meier estimator162 and a log-rank test (Mantel-Cox test)163 on the different HGG subtypes.
Next, we used multivariate Cox (proportional hazards) regression analysis164 to model the following: a) tp53 scores + telomerase scores + extent of tumor resection + LGG group + HGG group, in which tp53 scores and telomerase scores are numeric, extent of tumor resection is categorical, and LGG group and HGG group are binary variables indicating whether the sample is in either broad histology grouping, b) tp53 scores + telomerase scores + extent of tumor resection for each cancer_group with an N>=3 deceased patients (DIPG, DMG, HGG, MB, and EPN), and c) quantiseq cell type fractions + CD274 expression + extent of tumor resection for each cancer_group with an N>=3 deceased patients (DIPG, DMG, HGG, MB, and EPN), in which quantiseq cell type fractions and CD274 expression are numeric.
Figure S1:OpenPBTA Project Workflow, Related to Figure 1. Biospecimens and data were collected by CBTN and PNOC. Genomic sequencing and harmonization (orange boxes) were performed by the Kids First Data Resource Center (KFDRC). Analyses in the green boxes were performed by contributors of the OpenPBTA project. Output files are denoted in blue. Figure created with BioRender.com.
Figure S2:Validation of Consensus SNV calls and Tumor Mutation Burden, Related to Figures 2 and 3. Correlation (A) and violin (B) plots of mutation variant allele frequencies (VAFs) comparing the variant callers (Lancet, Strelka2, Mutect2, and VarDict) used for PBTA samples. UpSet plot (C) showing overlap of variant calls. Correlation (D) and violin (E) plots of mutation variant allele frequencies (VAFs) comparing the variant callers (Lancet, Strelka2, and Mutect2) used for TCGA samples. UpSet plot (F) showing overlap of variant calls. Violin plots (G) showing VAFs for Lancet calls performed on WGS and WXS from the same tumor (N = 52 samples from 13 patients). Cumulative distribution TMB plots for PBTA (H) and TCGA (I) tumors using consensus SNV calls.
Figure S3:Genomic instability of pediatric brain tumors, Related to Figures 2 and 3. (A) Violin plots of tumor purity by cancer group. Dots represent the group median. (B) Oncoprint of canonical somatic gene mutations, CNVs, fusions, and TMB (top bar plot) for the top mutated genes across rare CNS tumors: desmoplastic infantile astrocytoma and ganglioglioma (N = 2), germinoma (N = 4), glial-neuronal NOS (N = 8), metastatic secondary tumors (N = 2), neurocytoma (N = 2), pineoblastoma (N = 4), Rosai-Dorfman disease (N = 2), and sarcomas (N = 4). Patient sex (Germline sex estimate) and tumor histology (Cancer Group) are displayed as annotations at the bottom of each plot. Multiple CNVs are denoted as a complex event. N denotes the number of unique tumors with one tumor per patient used. (C) Genome-wide plot of CNV alterations by broad histology. Each row represents one sample. Box and whisker plots of number of CNV breaks (D) or SV breaks (E) by number of chromothripsis regions. Box plot represents 5% (lower whisker), 25% (lower box), 50% (median), 75% (upper box), and 95% (upper whisker) quantiles.
Figure S4:Mutational signatures in pediatric brain tumors, Related to Figure 3. (A) Sample-specific RefSig signature weights across cancer groups ordered by decreasing Signature 1 exposure. (B) Proportion of Signature 1 plotted by phase of therapy for each cancer group.
Figure S5:Quality control metrics for TP53 and EXTEND scores, Related to Figure 4. (A) Receiver Operating Characteristic for TP53 classifier run on FPKM of poly-A RNA-Seq samples. Correlation plots for telomerase scores (EXTEND) with RNA expression of TERT (B) and TERC (C). Red dots in B and C denote samples with known TERT promoter (TERTp) mutations.
Figure S6:Subtype-specific clustering and immune cell fractions, Related to Figure 5. First two dimensions from UMAP of sample transcriptome data with points colored by molecular_subtype for medulloblastoma (A), ependymoma (B), low-grade glioma (C), and high-grade glioma (D). (E) Box plots of quanTIseq estimates of immune cell fractions in histologies with more than one molecular subtype with N >=3. (F) Box plots of the ratio of immune cell fractions of CD8+ to CD4+ T cells in histologies with more than one molecular subtype with N >=3. Box plot represents 5% (lower whisker), 25% (lower box), 50% (median), 75% (upper box), and 95% (upper whisker) quantiles.
Figure S7:RNA batch and tumor purity assessment, Related to Figures 4 and 5. Bar plot (A) and UMAP (B) of RNA-Seq samples by cancer group and library preparation method. (C) UMAP of RNA-Seq samples by cancer group and sequencing center. For (D-I), RNA-Seq samples were thresholded by median cancer group tumor purity and transcriptomic analyses in Figure 4A-D (D-G) and Figure 5A,C (H-I) were repeated.
Table S1. Related to Figure 1.
Table of specimens and associated metadata, clinical data, and histological data utilized in the OpenPBTA project.
Table S2. Related to Figures 2 and 3.
Excel file with four sheets, where the first three represent tables of TMB, eight CNS mutational signatures, and chromothripsis events per sample, respectively, and the fourth sheet shows summarized genomic alterations across cancer groups.
Table S3. Related to Figures 4 and 5.
Excel file with three sheets representing tables of TP53 scores, telomerase EXTEND scores, and quanTIseq immune scores, respectively.
Table S4. Related to Figures 4 and 5.
Excel file with six sheets representing the survival analyses performed for this manuscript.
See Star Methods for details.
Table S5. Related to Figure 1.
Excel file with four sheets representing of all software and their respective versions used for the OpenPBTA project, including the R packages in the OpenPBTA Docker image, Python packages i the OpenPBTA Docker image, other command line tools in the OpenPBTA Docker image, and all software used in the OpenPBTA workflows, respectively.
Note that all software in the OpenPBTA Docker image was utilized within the analysis repository, but not all software was used for the final manuscript.
Consortia
The past and present members of the Children’s Brain Tumor Network who contributed to the generation of specimens and data are Adam C. Resnick, Alexa Plisiewicz, Allison M. Morgan, Allison P. Heath, Alyssa Paul, Amanda Saratsis, Amy Smith, Ana Aguilar, Ana Guerreiro Stücklin, Anastasia Arynchyna, Andrea Franson, Angela J. Waanders, Angela N. Viaene, Anita Nirenberg, Anna Maria Buccoliero, Anna Yaffe, Anny Shai, Anthony Bet, Antoinette Price, Arlene Luther, Ashley Plant, Augustine Eze, Bailey K. Farrow, Baoli Hu, Beth Frenkel, Bo Zhang, Bobby Moulder, Bonnie Cole, Brian M. Ennis, Brian R. Rood, Brittany Lebert, Carina A. Leonard, Carl Koschmann, Caroline Caudill, Caroline Drinkwater, Cassie N. Kline, Catherine Sullivan, Chanel Keoni, Chiara Caporalini, Christine Bobick-Butcher, Christopher Mason, Chunde Li, Claire Carter, Claudia MaduroCoronado, Clayton Wiley, Cynthia Wong, David E. Kram, David Haussler, David Kram, David Pisapia, David Ziegler, Denise Morinigo, Derek Hanson, Donald W. Parsons, Elizabeth Appert, Emily Drake, Emily Golbeck, Ena Agbodza, Eric H. Raabe, Eric M. Jackson, Erin Alexander, Esteban Uceda, Eugene Hwang, Fausto Rodriquez, Gabrielle S. Stone, Gary Kohanbash, Gavriella Silverman, George Rafidi, Gerald Grant, Gerri Trooskin, Gilad Evrony, Graham Keyes, Hagop Boyajian, Holly B. Lindsay, Holly C. Beale, Ian F. Pollack, James Johnston, James Palmer, Jane Minturn, Jared Pisapia, Jason E. Cain, Jason R. Fangusaro, Javad Nazarian, Jeanette Haugh, Jeff Stevens, Jeffrey P. Greenfield, Jeffrey Rubens, Jena V. Lilly, Jennifer L. Mason, Jessica B. Foster, Jim Olson, Jo Lynne Rokita, Joanna J. Phillips, Jonathan Waller, Josh Rubin, Judy E. Palma, Justin McCroskey, Justine Rizzo, Kaitlin Lehmann, Kamnaa Arya, Karlene Hall, Katherine Pehlivan, Kenneth Seidl, Kimberly Diamond, Kristen Harnett, Kristina A. Cole, Krutika S. Gaonkar, Lamiya Tauhid, Laura Prolo, Leah Holloway, Leslie Brosig, Lina Lopez, Lionel Chow, Madhuri Kambhampati, Mahdi Sarmady, Margaret Nevins, Mari Groves, Mariarita Santi-Vicini, Marilyn M. Li, Marion Mateos, Mateusz Koptyra, Matija Snuderl, Matthew Miller, Matthew Sklar, Matthew Wood, Meghan Connors, Melissa Williams, Meredith Egan, Michael Fisher, Michael Koldobskiy, Michelle Monje, Migdalia Martinez, Miguel A. Brown, Mike Prados, Miriam Bornhorst, Mirko Scagnet, Mohamed AbdelBaki, Monique Carrero-Tagle, Nadia Dahmane, Nalin Gupta, Nathan Young, Nicholas A. Vitanza, Nicholas Tassone, Nicholas Van Kuren, Nicolas Gerber, Nithin D. Adappa, Nitin Wadhwani, Noel Coleman, Obi Obayashi, Olena M. Vaske, Olivier Elemento, Oren Becher, Philbert Oliveros, Phillip B. Storm, Pichai Raman, Prajwal Rajappa, Rintaro Hashizume, Rishi R. Lulla, Robert Keating, Robert M. Lober, Ron Firestein, Sabine Mueller, Sameer Agnihotri, Samuel G. Winebrake, Samuel Rivero-Hinojosa, Sarah Diane Black, Sarah Leary, Schuyler Stoller, Shannon Robins, Sharon Gardner, Shelly Wang, Sherri Mayans, Sherry Tutson, Shida Zhu, Sofie R. Salama, Sonia Partap, Sonika Dahiya, Sriram Venneti, Stacie Stapleton, Stephani Campion, Stephanie Stefankiewicz, Stewart Goldman, Swetha Thambireddy, Tatiana S. Patton, Teresa Hidalgo, Theo Nicolaides, Thinh Q. Nguyen, Thomas W. McLean, Tiffany Walker, Toba Niazi, Tobey MacDonald, Valeria Lopez-Gil, Valerie Baubet, Whitney Rife, Xiao-Nan Li, Ximena Cuellar, Yiran Guo, Yuankun Zhu, and Zeinab Helil.
The past and present members of the Pacific Pediatric Neuro-Oncology Consortium who contributed to the generation of specimens and data are Adam C. Resnick, Alicia Lenzen, Alyssa Reddy, Amar Gajjar, Ana Guerreiro Stucklin, Anat Epstein, Andrea Franson, Angela Waanders, Anne Bendel, Anu Banerjee, Ashley Margol, Ashley Plant, Brian Rood, Carl Koschmann, Carol Bruggers, Caroline Hastings, Cassie N. Kline, Christina Coleman Abadi, Christopher Tinkle, Corey Raffel, Dan Runco, Daniel Landi, Daphne Adele Haas-Kogan, David Ashley, David Ziegler, Derek Hanson, Dong Anh Khuong Quang, Duane Mitchell, Elias Sayour, Eric Jackson, Eric Raabe, Eugene Hwang, Fatema Malbari, Geoffrey McCowage, Girish Dhall, Gregory Friedman, Hideho Okada, Ibrahim Qaddoumi, Iris Fried, Jae Cho, Jane Minturn, Jason Blatt, Javad Nazarian, Jeffrey Rubens, Jena V. Lilly, Jennifer Elster, Jennifer L. Mason, Jessica Schulte, Jonathan Schoenfeld, Josh Rubin, Karen Gauvain, Karen Wright, Katharine Offer, Katie Metrock, Kellie Haworth, Ken Cohen, Kristina A. Cole, Lance Governale, Linda Stork, Lindsay Kilburn, Lissa Baird, Maggie Skrypek, Marcia Leonard, Margaret Shatara, Margot Lazow, Mariella Filbin, Maryam Fouladi, Matthew Miller, Megan Paul, Michael Fisher, Michael Koldobskiy, Michael Prados, Michal Yalon Oren, Mimi Bandopadhayay, Miriam Bornhorst, Mohamed AbdelBaki, Nalin Gupta, Nathan Robison, Nicholas Whipple, Nick Gottardo, Nicholas A. Vitanza, Nicolas Gerber, Patricia Robertson, Payal Jain, Peter Sun, Priya Chan, Richard S Lemons, Robert Wechsler-Reya, Roger Packer, Russ Geyer, Ryan Velasco, Sabine Mueller, Sahaja Acharya, Sam Cheshier, Sarah Leary, Scott Coven, Sebastian M. Waszak, Sharon Gardner, Sri Gururangan, Stewart Goldman, Susan Chi, Tab Cooney, Tatiana S. Patton, Theodore Nicolaides, and Tom Belle Davidson.
References
1.
Ostrom, Q.T., Cioffi, G., Gittleman, H., Patil, N., Waite, K., Kruchko, C., and Barnholtz-Sloan, J.S. (2019). CBTRUS Statistical Report: Primary Brain and Other Central Nervous System Tumors Diagnosed in the United States in 2012–2016. Neuro-Oncology 21, v1–v100. 10.1093/neuonc/noz150.
2.
Ostrom, Q.T., Gittleman, H., Xu, J., Kromer, C., Wolinsky, Y., Kruchko, C., and Barnholtz-Sloan, J.S. (2016). CBTRUS Statistical Report: Primary Brain and Other Central Nervous System Tumors Diagnosed in the United States in 2009–2013. Neuro-Oncology 18, v1–v75. 10.1093/neuonc/now207.
3.
Blank, P.M., Ostrom, Q.T., Rouse, C., Wolinsky, Y., Kruchko, C., Salcido, J., and Barnholtz‐Sloan, J.S. (2015). Years of life lived with disease and years of potential life lost in children who die of cancer in the United States, 2009. Cancer Med 4, 608–619. 10.1002/cam4.410.
4.
Lilly, J.V., Rokita, J.L., Mason, J.L., Patton, T., Stefankiewiz, S., Higgins, D., Trooskin, G., Larouci, C.A., Arya, K., Appert, E., et al. (2023). The children's brain tumor network (CBTN) - Accelerating research in pediatric central nervous system tumors through collaboration and open science. Neoplasia 35, 100846. 10.1016/j.neo.2022.100846.
Vable, A.M., Diehl, S.F., and Glymour, M.M. (2021). Code Review as a Simple Trick to Enhance Reproducibility, Accelerate Learning, and Improve the Quality of Your Team’s Research. American Journal of Epidemiology 190, 2172–2177. 10.1093/aje/kwab092.
Beaulieu-Jones, B.K., and Greene, C.S. (2017). Reproducibility of computational workflows is automated using continuous analysis. Nat Biotechnol 35, 342–346. 10.1038/nbt.3780.
9.
Dang, M.T., Gonzalez, M.V., Gaonkar, K.S., Rathi, K.S., Young, P., Arif, S., Zhai, L., Alam, Z., Devalaraja, S., To, T.K.J., et al. (2021). Macrophages in SHH subgroup medulloblastoma display dynamic heterogeneity that varies with treatment modality. Cell Reports 34, 108917. 10.1016/j.celrep.2021.108917.
10.
Kline, C., Jain, P., Kilburn, L., Bonner, E.R., Gupta, N., Crawford, J.R., Banerjee, A., Packer, R.J., Villanueva-Meyer, J., Luks, T., et al. (2022). Upfront Biology-Guided Therapy in Diffuse Intrinsic Pontine Glioma: Therapeutic, Molecular, and Biomarker Outcomes from PNOC003. Clin Cancer Res 28, 3965–3978. 10.1158/1078-0432.ccr-22-0803.
11.
Foster, J.B., Griffin, C., Rokita, J.L., Stern, A., Brimley, C., Rathi, K., Lane, M.V., Buongervino, S.N., Smith, T., Madsen, P.J., et al. (2022). Development of GPC2-directed chimeric antigen receptors using mRNA for pediatric brain tumors. J Immunother Cancer 10, e004450. 10.1136/jitc-2021-004450.
12.
Stundon, J.L., Ijaz, H., Gaonkar, K.S., Kaufman, R.S., Jin, R., Karras, A., Vaksman, Z., Kim, J., Corbett, R.J., Lueder, M.R., et al. (2022). Alternative lengthening of telomeres (ALT) in pediatric high-grade gliomas can occur without ATRX mutation and is enriched in patients with pathogenic germline mismatch repair (MMR) variants. Neuro-Oncology, noac278. 10.1093/neuonc/noac278.
13.
Ijaz, H., Koptyra, M., Gaonkar, K.S., Rokita, J.L., Baubet, V.P., Tauhid, L., Zhu, Y., Brown, M., Lopez, G., Zhang, B., et al. (2019). Pediatric high-grade glioma resources from the Children’s Brain Tumor Tissue Consortium. Neuro-Oncology 22, 163–165. 10.1093/neuonc/noz192.
14.
Mueller, S., Jain, P., Liang, W.S., Kilburn, L., Kline, C., Gupta, N., Panditharatna, E., Magge, S.N., Zhang, B., Zhu, Y., et al. (2019). A pilot precision medicine trial for children with diffuse intrinsic pontine glioma—PNOC003: A report from the Pacific Pediatric Neuro‐Oncology Consortium. Int. J. Cancer. 10.1002/ijc.32258.
15.
Himmelstein, D.S., Rubinetti, V., Slochower, D.R., Hu, D., Malladi, V.S., Greene, C.S., and Gitter, A. (2019). Open collaborative writing with Manubot. PLoS Comput Biol 15, e1007128. 10.1371/journal.pcbi.1007128.
Boettiger, C., and Eddelbuettel, D. (2017). An Introduction to Rocker: Docker Containers for R. arXiv, 1710.03675. 10.48550/arXiv.1710.03675.
18.
Kleihues, P., Louis, D.N., Scheithauer, B.W., Rorke, L.B., Reifenberger, G., Burger, P.C., and Cavenee, W.K. (2002). The WHO classification of tumors of the nervous system. J Neuropathol Exp Neurol 61, 215-25; discussion 226-9. 10.1093/jnen/61.3.215.
19.
Louis, D.N., Ohgaki, H., Wiestler, O.D., Cavenee, W.K., Burger, P.C., Jouvet, A., Scheithauer, B.W., and Kleihues, P. (2007). The 2007 WHO Classification of Tumours of the Central Nervous System. Acta Neuropathol 114, 97–109. 10.1007/s00401-007-0243-4.
20.
Louis, D.N., Perry, A., Reifenberger, G., von Deimling, A., Figarella-Branger, D., Cavenee, W.K., Ohgaki, H., Wiestler, O.D., Kleihues, P., and Ellison, D.W. (2016). The 2016 World Health Organization Classification of Tumors of the Central Nervous System: a summary. Acta Neuropathol 131, 803–820. 10.1007/s00401-016-1545-1.
21.
Ryall, S., Zapotocky, M., Fukuoka, K., Nobre, L., Guerreiro Stucklin, A., Bennett, J., Siddaway, R., Li, C., Pajovic, S., Arnoldo, A., et al. (2020). Integrated Molecular and Clinical Analysis of 1,000 Pediatric Low-Grade Gliomas. Cancer Cell 37, 569–583.e5. 10.1016/j.ccell.2020.03.011.
22.
Rathi, K.S., Arif, S., Koptyra, M., Naqvi, A.S., Taylor, D.M., Storm, P.B., Resnick, A.C., Rokita, J.L., and Raman, P. (2020). A transcriptome-based classifier to determine molecular subtypes in medulloblastoma. PLoS Comput Biol 16, e1008263. 10.1371/journal.pcbi.1008263.
23.
Gendoo, D.M.A., and Haibe-Kains, B. (2016). MM2S: personalized diagnosis of medulloblastoma patients and model systems. Source Code Biol Med 11, 6. 10.1186/s13029-016-0053-y.
24.
Campbell, B.B., Light, N., Fabrizio, D., Zatzman, M., Fuligni, F., de Borja, R., Davidson, S., Edwards, M., Elvin, J.A., Hodel, K.P., et al. (2017). Comprehensive Analysis of Hypermutation in Human Cancer. Cell 171, 1042–1056.e10. 10.1016/j.cell.2017.09.048.
25.
Ryall, S., Tabori, U., and Hawkins, C. (2020). Pediatric low-grade glioma in the era of molecular diagnostics. acta neuropathol commun 8, 30. 10.1186/s40478-020-00902-z.
26.
Lambo, S., von Hoff, K., Korshunov, A., Pfister, S.M., and Kool, M. (2020). ETMR: a tumor entity in its infancy. Acta Neuropathol 140, 249–266. 10.1007/s00401-020-02182-2.
27.
Richardson, S., Hill, R.M., Kui, C., Lindsey, J.C., Grabovksa, Y., Keeling, C., Pease, L., Bashton, M., Crosier, S., Vinci, M., et al. (2021). Emergence and maintenance of actionable genetic drivers at medulloblastoma relapse. Neuro-Oncology 24, 153–165. 10.1093/neuonc/noab178.
28.
Łastowska, M., Trubicka, J., Sobocińska, A., Wojtas, B., Niemira, M., Szałkowska, A., Krętowski, A., Karkucińska-Więckowska, A., Kaleta, M., Ejmont, M., et al. (2020). Molecular identification of CNS NB-FOXR2, CNS EFT-CIC, CNS HGNET-MN1 and CNS HGNET-BCOR pediatric brain tumors using tumor-specific signature genes. acta neuropathol commun 8, 105. 10.1186/s40478-020-00984-9.
29.
Northcott, P.A., Buchhalter, I., Morrissy, A.S., Hovestadt, V., Weischenfeldt, J., Ehrenberger, T., Gröbner, S., Segura-Wang, M., Zichner, T., Rudneva, V.A., et al. (2017). The whole-genome landscape of medulloblastoma subtypes. Nature 547, 311–317. 10.1038/nature22973.
30.
Haase, S., Garcia-Fabiani, M.B., Carney, S., Altshuler, D., Núñez, F.J., Méndez, F.M., Núñez, F., Lowenstein, P.R., and Castro, M.G. (2018). Mutant ATRX: uncovering a new therapeutic target for glioma. Expert Opinion on Therapeutic Targets 22, 599–613. 10.1080/14728222.2018.1487953.
31.
Mackay, A., Burford, A., Carvalho, D., Izquierdo, E., Fazal-Salom, J., Taylor, K.R., Bjerke, L., Clarke, M., Vinci, M., Nandhabalan, M., et al. (2017). Integrated Molecular Meta-Analysis of 1,000 Pediatric High-Grade and Diffuse Intrinsic Pontine Glioma. Cancer Cell 32, 520–537.e5. 10.1016/j.ccell.2017.08.017.
32.
Pratt, D., Quezado, M., Abdullaev, Z., Hawes, D., Yang, F., Garton, H.J.L., Judkins, A.R., Mody, R., Chinnaiyan, A., Aldape, K., et al. (2020). Diffuse intrinsic pontine glioma-like tumor with EZHIP expression and molecular features of PFA ependymoma. acta neuropathol commun 8, 37. 10.1186/s40478-020-00905-w.
33.
Parker, M., Mohankumar, K.M., Punchihewa, C., Weinlich, R., Dalton, J.D., Li, Y., Lee, R., Tatevossian, R.G., Phoenix, T.N., Thiruvenkatam, R., et al. (2014). C11orf95–RELA fusions drive oncogenic NF-κB signalling in ependymoma. Nature 506, 451–455. 10.1038/nature13109.
34.
Surrey, L.F., Jain, P., Zhang, B., Straka, J., Zhao, X., Harding, B.N., Resnick, A.C., Storm, P.B., Buccoliero, A.M., Genitori, L., et al. (2019). Genomic Analysis of Dysembryoplastic Neuroepithelial Tumor Spectrum Reveals a Diversity of Molecular Alterations Dysregulating the MAPK and PI3K/mTOR Pathways. Journal of Neuropathology & Experimental Neurology 78, 1100–1111. 10.1093/jnen/nlz101.
35.
Sievers, P., Sill, M., Schrimpf, D., Stichel, D., Reuss, D.E., Sturm, D., Hench, J., Frank, S., Krskova, L., Vicha, A., et al. (2020). A subset of pediatric-type thalamic gliomas share a distinct DNA methylation profile, H3K27me3 loss and frequent alteration of EGFR. Neuro-Oncology 23, 34–43. 10.1093/neuonc/noaa251.
36.
(2014). The genomic landscape of diffuse intrinsic pontine glioma and pediatric non-brainstem high-grade glioma. Nat Genet 46, 444–450. 10.1038/ng.2938.
37.
Northcott, P.A., Jones, D.T.W., Kool, M., Robinson, G.W., Gilbertson, R.J., Cho, Y.-J., Pomeroy, S.L., Korshunov, A., Lichter, P., Taylor, M.D., et al. (2012). Medulloblastomics: the end of the beginning. Nat Rev Cancer 12, 818–834. 10.1038/nrc3410.
38.
Pfaff, E., Remke, M., Sturm, D., Benner, A., Witt, H., Milde, T., von Bueren, A.O., Wittmann, A., Schöttler, A., Jorch, N., et al. (2010). TP53 Mutation Is Frequently Associated With CTNNB1 Mutation or MYCN Amplification and Is Compatible With Long-Term Survival in Medulloblastoma. JCO 28, 5188–5196. 10.1200/jco.2010.31.1670.
39.
Lucas, C.-H.G., Gupta, R., Doo, P., Lee, J.C., Cadwell, C.R., Ramani, B., Hofmann, J.W., Sloan, E.A., Kleinschmidt-DeMasters, B.K., Lee, H.S., et al. (2020). Comprehensive analysis of diverse low-grade neuroepithelial tumors with FGFR1 alterations reveals a distinct molecular signature of rosette-forming glioneuronal tumor. acta neuropathol commun 8, 151. 10.1186/s40478-020-01027-z.
Degasperi, A., Amarante, T.D., Czarnecki, J., Shooter, S., Zou, X., Glodzik, D., Morganella, S., Nanda, A.S., Badja, C., Koh, G., et al. (2020). A practical framework and online tool for mutational signature analyses show intertissue variation and driver dependencies. Nat Cancer 1, 249–263. 10.1038/s43018-020-0027-5.
42.
Wojciechowicz, K., Cantelli, E., Van Gerwen, B., Plug, M., Van Der Wal, A., Delzenne-Goette, E., Song, J.-Y., De Vries, S., Dekker, M., and Riele, H.T. (2014). Temozolomide Increases the Number of Mismatch Repair–Deficient Intestinal Crypts and Accelerates Tumorigenesis in a Mouse Model of Lynch Syndrome. Gastroenterology 147, 1064–1072.e5. 10.1053/j.gastro.2014.07.052.
43.
Knijnenburg, T.A., Wang, L., Zimmermann, M.T., Chambwe, N., Gao, G.F., Cherniack, A.D., Fan, H., Shen, H., Way, G.P., Greene, C.S., et al. (2018). Genomic and Molecular Landscape of DNA Damage Repair Deficiency across The Cancer Genome Atlas. Cell Reports 23, 239–254.e6. 10.1016/j.celrep.2018.03.076.
44.
Dittmer, D., Pati, S., Zambetti, G., Chu, S., Teresky, A.K., Moore, M., Finlay, C., and Levine, A.J. (1993). Gain of function mutations in p53. Nat Genet 4, 42–46. 10.1038/ng0593-42.
45.
Noureen, N., Wu, S., Lv, Y., Yang, J., Alfred Yung, W.K., Gelfond, J., Wang, X., Koul, D., Ludlow, A., and Zheng, S. (2021). Integrated analysis of telomerase enzymatic activity unravels an association with cancer stemness and proliferation. Nat Commun 12, 139. 10.1038/s41467-020-20474-9.
46.
Artandi, S.E., and DePinho, R.A. (2009). Telomeres and telomerase in cancer. Carcinogenesis 31, 9–18. 10.1093/carcin/bgp268.
47.
Ceja-Rangel, H.A., Sánchez-Suárez, P., Castellanos-Juárez, E., Peñaroja-Flores, R., Arenas-Aranda, D.J., Gariglio, P., and Benítez-Bribiesca, L. (2016). Shorter telomeres and high telomerase activity correlate with a highly aggressive phenotype in breast cancer cell lines. Tumor Biol. 37, 11917–11926. 10.1007/s13277-016-5045-7.
48.
Oh, B.-K., Kim, H., Park, Y.N., Yoo, J.E., Choi, J., Kim, K.-S., Lee, J.J., and Park, C. (2008). High telomerase activity and long telomeres in advanced hepatocellular carcinomas with poor prognosis. Laboratory Investigation 88, 144–152. 10.1038/labinvest.3700710.
49.
Kulić, A., Plavetić, N.D., Gamulin, S., Jakić-Razumović, J., Vrbanec, D., and Sirotković-Skerlev, M. (2016). Telomerase activity in breast cancer patients: association with poor prognosis and more aggressive phenotype. Med Oncol 33, 23. 10.1007/s12032-016-0736-x.
50.
Wong, V.C.H., Morrison, A., Tabori, U., and Hawkins, C.E. (2010). Telomerase Inhibition as a Novel Therapy for Pediatric Ependymoma. Brain Pathology 20, 780–786. 10.1111/j.1750-3639.2010.00372.x.
Pich, O., Muiños, F., Lolkema, M.P., Steeghs, N., Gonzalez-Perez, A., and Lopez-Bigas, N. (2019). The mutational footprints of cancer therapies. Nat Genet 51, 1732–1740. 10.1038/s41588-019-0525-5.
53.
Aronson, M., Colas, C., Shuen, A., Hampel, H., Foulkes, W.D., Baris Feldman, H., Goldberg, Y., Muleris, M., Wolfe Schneider, K., McGee, R.B., et al. (2021). Diagnostic criteria for constitutional mismatch repair deficiency (CMMRD): recommendations from the international consensus working group. J Med Genet 59, 318–327. 10.1136/jmedgenet-2020-107627.
54.
Vuong, H.G., Le, H.T., Ngo, T.N.M., Fung, K.-M., Battiste, J.D., McNall-Knapp, R., and Dunn, I.F. (2021). H3K27M-mutant diffuse midline gliomas should be further molecularly stratified: an integrated analysis of 669 patients. J Neurooncol 155, 225–234. 10.1007/s11060-021-03890-9.
55.
Lewis, P.W., Müller, M.M., Koletsky, M.S., Cordero, F., Lin, S., Banaszynski, L.A., Garcia, B.A., Muir, T.W., Becher, O.J., and Allis, C.D. (2013). Inhibition of PRC2 Activity by a Gain-of-Function H3 Mutation Found in Pediatric Glioblastoma. Science 340, 857–861. 10.1126/science.1232245.
56.
Hutter, S., Bolin, S., Weishaupt, H., and Swartling, F. (2017). Modeling and Targeting MYC Genes in Childhood Brain Tumors. Genes 8, 107. 10.3390/genes8040107.
57.
Leone, G., Sears, R., Huang, E., Rempel, R., Nuckolls, F., Park, C.H., Giangrande, P., Wu, L., Saavedra, H.I., Field, S.J., et al. (2001). Myc requires distinct E2F activities to induce S phase and apoptosis. Mol Cell 8, 105–113. 10.1016/s1097-2765(01)00275-1.
58.
Hannan, C.J., Lewis, D., O’Leary, C., Donofrio, C.A., Evans, D.G., Roncaroli, F., Brough, D., King, A.T., Coope, D., and Pathmanaban, O.N. (2020). The inflammatory microenvironment in vestibular schwannoma. Neuro-Oncology Advances 2, vdaa023. 10.1093/noajnl/vdaa023.
59.
Petralia, F., Tignor, N., Reva, B., Koptyra, M., Chowdhury, S., Rykunov, D., Krek, A., Ma, W., Zhu, Y., Ji, J., et al. (2020). Integrated Proteogenomic Characterization across Major Histological Types of Pediatric Brain Cancer. Cell 183, 1962–1985.e31. 10.1016/j.cell.2020.10.044.
60.
Lin, G.L., Nagaraja, S., Filbin, M.G., Suvà, M.L., Vogel, H., and Monje, M. (2018). Non-inflammatory tumor microenvironment of diffuse intrinsic pontine glioma. acta neuropathol commun 6, 51. 10.1186/s40478-018-0553-x.
61.
Ross, J.L., Velazquez Vega, J., Plant, A., MacDonald, T.J., Becher, O.J., and Hambardzumyan, D. (2021). Tumour immune landscape of paediatric high-grade gliomas. Brain 144, 2594–2609. 10.1093/brain/awab155.
62.
Martin, A.M., Nirschl, C.J., Polanczyk, M.J., Bell, W.R., Nirschl, T.R., Harris-Bookman, S., Phallen, J., Hicks, J., Martinez, D., Ogurtsova, A., et al. (2018). PD-L1 expression in medulloblastoma: an evaluation by subgroup. Oncotarget 9, 19177–19191. 10.18632/oncotarget.24951.
63.
Bockmayr, M., Mohme, M., Klauschen, F., Winkler, B., Budczies, J., Rutkowski, S., and Schüller, U. (2018). Subgroup-specific immune and stromal microenvironment in medulloblastoma. OncoImmunology 7, e1462430. 10.1080/2162402x.2018.1462430.
64.
Duchemann, B., Naigeon, M., Auclin, E., Ferrara, R., Cassard, L., Jouniaux, J.-M., Boselli, L., Grivel, J., Desnoyer, A., Danlos, F.-X., et al. (2022). CD8⁺PD-1⁺ to CD4⁺PD-1⁺ ratio (PERLS) is associated with prognosis of patients with advanced NSCLC treated with PD-(L)1 blockers. J Immunother Cancer 10, e004012. 10.1136/jitc-2021-004012.
65.
Shindo, G., Endo, T., Onda, M., Goto, S., Miyamoto, Y., and Kaneko, T. (2013). Is the CD4/CD8 Ratio an Effective Indicator for Clinical Estimation of Adoptive Immunotherapy for Cancer Treatment? JCT 04, 1382–1390. 10.4236/jct.2013.48164.
66.
Yuza, K., Nagahashi, M., Watanabe, S., Takabe, K., and Wakai, T. (2017). Hypermutation and microsatellite instability in gastrointestinal cancers. Oncotarget 8, 112103–112115. 10.18632/oncotarget.22783.
67.
Bass, A.J., Thorsson, V., Shmulevich, I., Reynolds, S.M., Miller, M., Bernard, B., Hinoue, T., Laird, P.W., Curtis, C., Shen, H., et al. (2014). Comprehensive molecular characterization of gastric adenocarcinoma. Nature 513, 202–209. 10.1038/nature13480.
68.
Sharma, J., Bonfield, C.M., Singhal, A., Hukin, J., and Steinbok, P. (2015). Intracystic interferon-α treatment leads to neurotoxicity in craniopharyngioma: case report. PED 16, 301–304. 10.3171/2015.2.peds14656.
69.
Mohammed, K.E.A., Mike, K.R.A., and Parkes, J. (2013). Unexpected brain atrophy following administration of intratumoral interferon alpha-2b for cystic craniopharyngioma: A case report. IJCRI 4, 719. 10.5348/ijcri-2013-12-419-cr-13.
70.
Coy, S., Rashid, R., Lin, J.-R., Du, Z., Donson, A.M., Hankinson, T.C., Foreman, N.K., Manley, P.E., Kieran, M.W., Reardon, D.A., et al. (2018). Multiplexed immunofluorescence reveals potential PD-1/PD-L1 pathway vulnerabilities in craniopharyngioma. Neuro-Oncology 20, 1101–1112. 10.1093/neuonc/noy035.
71.
Yuan, F., Cai, X., Zhu, J., Yuan, L., Wang, Y., Tang, C., Cong, Z., and Ma, C. (2021). A Novel Immune Classification for Predicting Immunotherapy Responsiveness in Patients With Adamantinomatous Craniopharyngioma. Front Neurol 12, 704130. 10.3389/fneur.2021.704130.
72.
Whelan, R., Prince, E., Gilani, A., and Hankinson, T. (2020). The Inflammatory Milieu of Adamantinomatous Craniopharyngioma and Its Implications for Treatment. J Clin Med 9, 519. 10.3390/jcm9020519.
73.
Apps, J.R., Carreno, G., Gonzalez-Meljem, J.M., Haston, S., Guiho, R., Cooper, J.E., Manshaei, S., Jani, N., Hölsken, A., Pettorini, B., et al. (2018). Tumour compartment transcriptomics demonstrates the activation of inflammatory and odontogenic programmes in human adamantinomatous craniopharyngioma and identifies the MAPK/ERK pathway as a novel therapeutic target. Acta Neuropathol 135, 757–777. 10.1007/s00401-018-1830-2.
74.
Grob, S., Mirsky, D.M., Donson, A.M., Dahl, N., Foreman, N.K., Hoffman, L.M., Hankinson, T.C., and Mulcahy Levy, J.M. (2019). Targeting IL-6 Is a Potential Treatment for Primary Cystic Craniopharyngioma. Front. Oncol. 9. 10.3389/fonc.2019.00791.
75.
Gaonkar, K.S., Marini, F., Rathi, K.S., Jain, P., Zhu, Y., Chimicles, N.A., Brown, M.A., Naqvi, A.S., Zhang, B., Storm, P.B., et al. (2020). annoFuse: an R Package to annotate, prioritize, and interactively explore putative oncogenic RNA fusions. BMC Bioinformatics 21, 577. 10.1186/s12859-020-03922-7.
Nygaard, V., Rødland, E.A., and Hovig, E. (2015). Methods that remove batch effects while retaining group differences may lead to exaggerated confidence in downstream analyses. Biostatistics 17, 29–39. 10.1093/biostatistics/kxv027.
79.
Goh, W.W.B., Wang, W., and Wong, L. (2017). Why Batch Effects Matter in Omics Data, and How to Avoid Them. Trends in Biotechnology 35, 498–507. 10.1016/j.tibtech.2017.02.012.
80.
Open Pediatric Brain Tumor Atlas, C.B.T.N., Pediatric Neuro Oncology Consortium (2022). Open Pediatric Brain Tumor Atlas. 10.24370/openpbta.
81.
Shapiro, J.A., Gaonkar, K.S., Spielman, S.J., Savonen, C.L., Bethell, C.J., Jin, R., Rathi, K.S., Zhu, Y., Egolf, L.E., Farrow, B.K., et al. (2023). Data underlying OpenPBTA Manuscript Figures and Molecular Alterations. 10.5281/zenodo.7805408.
82.
Lee, S., Lee, S., Ouellette, S., Park, W.-Y., Lee, E.A., and Park, P.J. (2017). NGSCheckMate: software for validating sample identity in next-generation sequencing studies within and across data types. Nucleic Acids Research 45, e103–e103. 10.1093/nar/gkx193.
83.
Li, H. (2013). Aligning sequence reads, clone sequences and assembly contigs with BWA-MEM. arXiv, 1303.3997. 10.48550/arXiv.1303.3997.
84.
DePristo, M.A., Banks, E., Poplin, R., Garimella, K.V., Maguire, J.R., Hartl, C., Philippakis, A.A., del Angel, G., Rivas, M.A., Hanna, M., et al. (2011). A framework for variation discovery and genotyping using next-generation DNA sequencing data. Nat Genet 43, 491–498. 10.1038/ng.806.
85.
Faust, G.G., and Hall, I.M. (2014). SAMBLASTER: fast duplicate marking and structural variant read extraction. Bioinformatics 30, 2503–2505. 10.1093/bioinformatics/btu314.
86.
Tarasov, A., Vilella, A.J., Cuppen, E., Nijman, I.J., and Prins, P. (2015). Sambamba: fast processing of NGS alignment formats. Bioinformatics 31, 2032–2034. 10.1093/bioinformatics/btv098.
87.
McKenna, A., Hanna, M., Banks, E., Sivachenko, A., Cibulskis, K., Kernytsky, A., Garimella, K., Altshuler, D., Gabriel, S., Daly, M., et al. (2010). The Genome Analysis Toolkit: A MapReduce framework for analyzing next-generation DNA sequencing data. Genome Res. 20, 1297–1303. 10.1101/gr.107524.110.
88.
Poplin, R., Ruano-Rubio, V., DePristo, M.A., Fennell, T.J., Carneiro, M.O., Auwera, G.A.V. der, Kling, D.E., Gauthier, L.D., Levy-Moonshine, A., Roazen, D., et al. (2018). Scaling accurate genetic variant discovery to tens of thousands of samples. bioRxiv, 201178. 10.1101/201178.
89.
DeLuca, D.S., Levin, J.Z., Sivachenko, A., Fennell, T., Nazaire, M.-D., Williams, C., Reich, M., Winckler, W., and Getz, G. (2012). RNA-SeQC: RNA-seq metrics for quality control and process optimization. Bioinformatics 28, 1530–1532. 10.1093/bioinformatics/bts196.
90.
Wang, K., Li, M., and Hakonarson, H. (2010). ANNOVAR: functional annotation of genetic variants from high-throughput sequencing data. Nucleic Acids Research 38, e164–e164. 10.1093/nar/gkq603.
91.
Landrum, M.J., Lee, J.M., Riley, G.R., Jang, W., Rubinstein, W.S., Church, D.M., and Maglott, D.R. (2013). ClinVar: public archive of relationships among sequence variation and human phenotype. Nucl. Acids Res. 42, D980–D985. 10.1093/nar/gkt1113.
92.
Cingolani, P., Patel, V.M., Coon, M., Nguyen, T., Land, S.J., Ruden, D.M., and Lu, X. (2012). Using Drosophila melanogaster as a Model for Genotoxic Chemical Mutational Studies with a New Program, SnpSift. Front. Gene. 3. 10.3389/fgene.2012.00035.
93.
Kim, S., Scheffler, K., Halpern, A.L., Bekritsky, M.A., Noh, E., Källberg, M., Chen, X., Kim, Y., Beyter, D., Krusche, P., et al. (2018). Strelka2: fast and accurate calling of germline and somatic variants. Nat Methods 15, 591–594. 10.1038/s41592-018-0051-x.
94.
Benjamin, D., Sato, T., Cibulskis, K., Getz, G., Stewart, C., and Lichtenstein, L. (2019). Calling Somatic SNVs and Indels with Mutect2. bioRxiv, 861054. 10.1101/861054.
95.
Narzisi, G., Corvelo, A., Arora, K., Bergmann, E.A., Shah, M., Musunuri, R., Emde, A.-K., Robine, N., Vacic, V., and Zody, M.C. (2018). Genome-wide somatic variant calling using localized colored de Bruijn graphs. Commun Biol 1, 20. 10.1038/s42003-018-0023-9.
96.
Lai, Z., Markovets, A., Ahdesmaki, M., Chapman, B., Hofmann, O., McEwen, R., Johnson, J., Dougherty, B., Barrett, J.C., and Dry, J.R. (2016). VarDict: a novel and versatile variant caller for next-generation sequencing in cancer research. Nucleic Acids Res 44, e108–e108. 10.1093/nar/gkw227.
97.
Arora, K., Shah, M., Johnson, M., Sanghvi, R., Shelton, J., Nagulapalli, K., Oschwald, D.M., Zody, M.C., Germer, S., Jobanputra, V., et al. (2019). Deep whole-genome sequencing of 3 cancer cell lines on 2 sequencing platforms. Sci Rep 9, 19123. 10.1038/s41598-019-55636-3.
98.
McLaren, W., Gil, L., Hunt, S.E., Riat, H.S., Ritchie, G.R.S., Thormann, A., Flicek, P., and Cunningham, F. (2016). The Ensembl Variant Effect Predictor. Genome Biol 17, 122. 10.1186/s13059-016-0974-4.
99.
Karczewski, K.J., Francioli, L.C., Tiao, G., Cummings, B.B., Alföldi, J., Wang, Q., Collins, R.L., Laricchia, K.M., Ganna, A., Birnbaum, D.P., et al. (2020). The mutational constraint spectrum quantified from variation in 141,456 humans. Nature 581, 434–443. 10.1038/s41586-020-2308-7.
100.
Zvereva, M., Pisarev, E., Hosen, I., Kisil, O., Matskeplishvili, S., Kubareva, E., Kamalov, D., Tivtikyan, A., Manel, A., Vian, E., et al. (2020). Activating Telomerase TERT Promoter Mutations and Their Application for the Detection of Bladder Cancer. IJMS 21, 6034. 10.3390/ijms21176034.
101.
Boeva, V., Popova, T., Bleakley, K., Chiche, P., Cappo, J., Schleiermacher, G., Janoueix-Lerosey, I., Delattre, O., and Barillot, E. (2011). Control-FREEC: a tool for assessing copy number and allelic content using next-generation sequencing data. Bioinformatics 28, 423–425. 10.1093/bioinformatics/btr670.
102.
Boeva, V., Zinovyev, A., Bleakley, K., Vert, J.-P., Janoueix-Lerosey, I., Delattre, O., and Barillot, E. (2010). Control-free calling of copy number alterations in deep-sequencing data using GC-content normalization. Bioinformatics 27, 268–269. 10.1093/bioinformatics/btq635.
103.
Talevich, E., Shain, A.H., Botton, T., and Bastian, B.C. (2016). CNVkit: Genome-Wide Copy Number Detection and Visualization from Targeted DNA Sequencing. PLoS Comput Biol 12, e1004873. 10.1371/journal.pcbi.1004873.
104.
Oesper, L., Satas, G., and Raphael, B.J. (2014). Quantifying tumor heterogeneity in whole-genome and whole-exome sequencing data. Bioinformatics 30, 3532–3540. 10.1093/bioinformatics/btu651.
105.
Mermel, C.H., Schumacher, S.E., Hill, B., Meyerson, M.L., Beroukhim, R., and Getz, G. (2011). GISTIC2.0 facilitates sensitive and confident localization of the targets of focal somatic copy-number alteration in human cancers. Genome Biol 12, R41. 10.1186/gb-2011-12-4-r41.
106.
Chen, X., Schulz-Trieglaff, O., Shaw, R., Barnes, B., Schlesinger, F., Källberg, M., Cox, A.J., Kruglyak, S., and Saunders, C.T. (2015). Manta: rapid detection of structural variants and indels for germline and cancer sequencing applications. Bioinformatics 32, 1220–1222. 10.1093/bioinformatics/btv710.
107.
Geoffroy, V., Herenger, Y., Kress, A., Stoetzel, C., Piton, A., Dollfus, H., and Muller, J. (2018). AnnotSV: an integrated tool for structural variations annotation. Bioinformatics 34, 3572–3574. 10.1093/bioinformatics/bty304.
108.
Dobin, A., Davis, C.A., Schlesinger, F., Drenkow, J., Zaleski, C., Jha, S., Batut, P., Chaisson, M., and Gingeras, T.R. (2012). STAR: ultrafast universal RNA-seq aligner. Bioinformatics 29, 15–21. 10.1093/bioinformatics/bts635.
109.
Li, B., and Dewey, C.N. (2011). RSEM: accurate transcript quantification from RNA-Seq data with or without a reference genome. BMC Bioinformatics 12, 323. 10.1186/1471-2105-12-323.
110.
Uhrig, S., Ellermann, J., Walther, T., Burkhardt, P., Fröhlich, M., Hutter, B., Toprak, U.H., Neumann, O., Stenzinger, A., Scholl, C., et al. (2021). Accurate and efficient detection of gene fusions from RNA sequencing data. Genome Res. 31, 448–460. 10.1101/gr.257246.119.
111.
Haas, B.J., Dobin, A., Stransky, N., Li, B., Yang, X., Tickle, T., Bankapur, A., Ganote, C., Doak, T.G., Pochet, N., et al. (2017). STAR-Fusion: Fast and Accurate Fusion Transcript Detection from RNA-Seq. bioRxiv, 120295. 10.1101/120295.
112.
Yoshihara, K., Shahmoradgoli, M., Martínez, E., Vegesna, R., Kim, H., Torres-Garcia, W., Treviño, V., Shen, H., Laird, P.W., Levine, D.A., et al. (2013). Inferring tumour purity and stromal and immune cell admixture from expression data. Nat Commun 4, 2612. 10.1038/ncomms3612.
113.
Mayakonda, A., Lin, D.-C., Assenov, Y., Plass, C., and Koeffler, H.P. (2018). Maftools: efficient and comprehensive analysis of somatic variants in cancer. Genome Res. 28, 1747–1756. 10.1101/gr.239244.118.
114.
Quinlan, A.R., and Hall, I.M. (2010). BEDTools: a flexible suite of utilities for comparing genomic features. Bioinformatics 26, 841–842. 10.1093/bioinformatics/btq033.
115.
Meyer, L.R., Zweig, A.S., Hinrichs, A.S., Karolchik, D., Kuhn, R.M., Wong, M., Sloan, C.A., Rosenbloom, K.R., Roe, G., Rhead, B., et al. (2012). The UCSC Genome Browser database: extensions and updates 2013. Nucleic Acids Research 41, D64–D69. 10.1093/nar/gks1048.
116.
Lawrence, M., Huber, W., Pagès, H., Aboyoun, P., Carlson, M., Gentleman, R., Morgan, M.T., and Carey, V.J. (2013). Software for Computing and Annotating Genomic Ranges. PLoS Comput Biol 9, e1003118. 10.1371/journal.pcbi.1003118.
117.
Gu, Z., Eils, R., and Schlesner, M. (2016). Complex heatmaps reveal patterns and correlations in multidimensional genomic data. Bioinformatics 32, 2847–2849. 10.1093/bioinformatics/btw313.
118.
Cortés-Ciriano, I., Lee, J.J.-K., Xi, R., Jain, D., Jung, Y.L., Yang, L., Gordenin, D., Klimczak, L.J., Zhang, C.-Z., Pellman, D.S., et al. (2020). Comprehensive analysis of chromothripsis in 2,658 human cancers using whole-genome sequencing. Nat Genet 52, 331–341. 10.1038/s41588-019-0576-7.
119.
Sturm, G., Finotello, F., Petitprez, F., Zhang, J.D., Baumbach, J., Fridman, W.H., List, M., and Aneichyk, T. (2019). Comprehensive evaluation of transcriptome-based cell-type quantification methods for immuno-oncology. Bioinformatics 35, i436–i445. 10.1093/bioinformatics/btz363.
120.
Finotello, F., Mayer, C., Plattner, C., Laschober, G., Rieder, D., Hackl, H., Krogsdam, A., Loncova, Z., Posch, W., Wilflingseder, D., et al. (2019). Molecular and pharmacological modulators of the tumor immune contexture revealed by deconvolution of RNA-seq data. Genome Med 11, 34. 10.1186/s13073-019-0638-6.
121.
Hänzelmann, S., Castelo, R., and Guinney, J. (2013). GSVA: gene set variation analysis for microarray and RNA-Seq data. BMC Bioinformatics 14, 7. 10.1186/1471-2105-14-7.
122.
Liberzon, A., Birger, C., Thorvaldsdóttir, H., Ghandi, M., Mesirov, Jill P., and Tamayo, P. (2015). The Molecular Signatures Database Hallmark Gene Set Collection. Cell Systems 1, 417–425. 10.1016/j.cels.2015.12.004.
123.
McInnes, L., Healy, J., and Melville, J. (2020). UMAP: Uniform Manifold Approximation and Projection for Dimension Reduction. arXiv, 1802.03426. 10.48550/arXiv.1802.03426.
124.
Lambert, S.A., Jolma, A., Campitelli, L.F., Das, P.K., Yin, Y., Albu, M., Chen, X., Taipale, J., Hughes, T.R., and Weirauch, M.T. (2018). The Human Transcription Factors. Cell 172, 650–665. 10.1016/j.cell.2018.01.029.
125.
Ramkissoon, L.A., Horowitz, P.M., Craig, J.M., Ramkissoon, S.H., Rich, B.E., Schumacher, S.E., McKenna, A., Lawrence, M.S., Bergthold, G., Brastianos, P.K., et al. (2013). Genomic analysis of diffuse pediatric low-grade gliomas identifies recurrent oncogenic truncating rearrangements in the transcription factor MYBL1. Proc. Natl. Acad. Sci. U.S.A. 110, 8188–8193. 10.1073/pnas.1300252110.
126.
Northcott, P.A., Shih, D.J.H., Peacock, J., Garzia, L., Sorana Morrissy, A., Zichner, T., Stütz, A.M., Korshunov, A., Reimand, J., Schumacher, S.E., et al. (2012). Subgroup-specific structural variation across 1,000 medulloblastoma genomes. Nature 488, 49–56. 10.1038/nature11327.
127.
Sturm, D., Orr, Brent A., Toprak, Umut H., Hovestadt, V., Jones, David T.W., Capper, D., Sill, M., Buchhalter, I., Northcott, Paul A., Leis, I., et al. (2016). New Brain Tumor Entities Emerge from Molecular Classification of CNS-PNETs. Cell 164, 1060–1072. 10.1016/j.cell.2016.01.015.
128.
Kleinman, C.L., Gerges, N., Papillon-Cavanagh, S., Sin-Chan, P., Pramatarova, A., Quang, D.-A.K., Adoue, V., Busche, S., Caron, M., Djambazian, H., et al. (2013). Fusion of TTYH1 with the C19MC microRNA cluster drives expression of a brain-specific DNMT3B isoform in the embryonal brain tumor ETMR. Nat Genet 46, 39–44. 10.1038/ng.2849.
129.
Valentijn, L.J., Koster, J., Zwijnenburg, D.A., Hasselt, N.E., van Sluis, P., Volckmann, R., van Noesel, M.M., George, R.E., Tytgat, G.A.M., Molenaar, J.J., et al. (2015). TERT rearrangements are frequent in neuroblastoma and identify aggressive tumors. Nat Genet 47, 1411–1414. 10.1038/ng.3438.
130.
Cobrinik, D., Ostrovnaya, I., Hassimi, M., Tickoo, S.K., Cheung, I.Y., and Cheung, N.-K.V. (2013). Recurrent pre-existing and acquired DNA copy number alterations, including focal TERT gains, in neuroblastoma central nervous system metastases. Genes Chromosomes Cancer 52, 1150–1166. 10.1002/gcc.22110.
131.
Karlsson, J., Lilljebjörn, H., Holmquist Mengelbier, L., Valind, A., Rissler, M., Øra, I., Fioretos, T., and Gisselsson, D. (2015). Activation of human telomerase reverse transcriptase through gene fusion in clear cell sarcoma of the kidney. Cancer Letters 357, 498–501. 10.1016/j.canlet.2014.11.057.
132.
Karsy, M., Guan, J., Cohen, A.L., Jensen, R.L., and Colman, H. (2017). New Molecular Considerations for Glioma: IDH, ATRX, BRAF, TERT, H3 K27M. Curr Neurol Neurosci Rep 17, 19. 10.1007/s11910-017-0722-5.
133.
Bandopadhayay, P., Ramkissoon, L.A., Jain, P., Bergthold, G., Wala, J., Zeid, R., Schumacher, S.E., Urbanski, L., O'Rourke, R., Gibson, W.J., et al. (2016). MYB-QKI rearrangements in angiocentric glioma drive tumorigenicity through a tripartite mechanism. Nat Genet 48, 273–282. 10.1038/ng.3500.
134.
Johann, P.D., Erkek, S., Zapatka, M., Kerl, K., Buchhalter, I., Hovestadt, V., Jones, D.T.W., Sturm, D., Hermann, C., Segura Wang, M., et al. (2016). Atypical Teratoid/Rhabdoid Tumors Are Comprised of Three Epigenetic Subgroups with Distinct Enhancer Landscapes. Cancer Cell 29, 379–393. 10.1016/j.ccell.2016.02.001.
Louis, D.N., Perry, A., Wesseling, P., Brat, D.J., Cree, I.A., Figarella-Branger, D., Hawkins, C., Ng, H.K., Pfister, S.M., Reifenberger, G., et al. (2021). The 2021 WHO Classification of Tumors of the Central Nervous System: a summary. Neuro-Oncology 23, 1231–1251. 10.1093/neuonc/noab106.
137.
Ryall, S., Guzman, M., Elbabaa, S.K., Luu, B., Mack, S.C., Zapotocky, M., Taylor, M.D., Hawkins, C., and Ramaswamy, V. (2017). H3 K27M mutations are extremely rare in posterior fossa group A ependymoma. Childs Nerv Syst 33, 1047–1051. 10.1007/s00381-017-3481-3.
138.
Pajtler, Kristian W., Witt, H., Sill, M., Jones, David T.W., Hovestadt, V., Kratochwil, F., Wani, K., Tatevossian, R., Punchihewa, C., Johann, P., et al. (2015). Molecular Classification of Ependymal Tumors across All CNS Compartments, Histopathological Grades, and Age Groups. Cancer Cell 27, 728–743. 10.1016/j.ccell.2015.04.002.
139.
Bi, W.L., Greenwald, N.F., Abedalthagafi, M., Wala, J., Gibson, W.J., Agarwalla, P.K., Horowitz, P., Schumacher, S.E., Esaulova, E., Mei, Y., et al. (2017). Genomic landscape of high-grade meningiomas. npj Genomic Med 2, 15. 10.1038/s41525-017-0014-7.
140.
Youngblood, M.W., Duran, D., Montejo, J.D., Li, C., Omay, S.B., Özduman, K., Sheth, A.H., Zhao, A.Y., Tyrtova, E., Miyagishima, D.F., et al. (2020). Correlations between genomic subgroup and clinical features in a cohort of more than 3000 meningiomas. Journal of Neurosurgery 133, 1345–1354. 10.3171/2019.8.jns191266.
141.
Qaddoumi, I., Orisme, W., Wen, J., Santiago, T., Gupta, K., Dalton, J.D., Tang, B., Haupfear, K., Punchihewa, C., Easton, J., et al. (2016). Genetic alterations in uncommon low-grade neuroepithelial tumors: BRAF, FGFR1, and MYB mutations occur at high frequency and align with morphology. Acta Neuropathol 131, 833–845. 10.1007/s00401-016-1539-z.
142.
Thomas, C., Soschinski, P., Zwaig, M., Oikonomopoulos, S., Okonechnikov, K., Pajtler, K.W., Sill, M., Schweizer, L., Koch, A., Neumann, J., et al. (2020). The genetic landscape of choroid plexus tumors in children and adults. Neuro-Oncology 23, 650–660. 10.1093/neuonc/noaa267.
143.
Sekine, S., Shibata, T., Kokubu, A., Morishita, Y., Noguchi, M., Nakanishi, Y., Sakamoto, M., and Hirohashi, S. (2002). Craniopharyngiomas of adamantinomatous type harbor beta-catenin gene mutations. Am J Pathol 161, 1997–2001. 10.1016/s0002-9440(10)64477-x.
144.
Krooks, J., Minkov, M., and Weatherall, A.G. (2018). Langerhans cell histiocytosis in children. Journal of the American Academy of Dermatology 78, 1035–1044. 10.1016/j.jaad.2017.05.059.
145.
Antin, C., Tauziède-Espariat, A., Debily, M.-A., Castel, D., Grill, J., Pagès, M., Ayrault, O., Chrétien, F., Gareton, A., Andreiuolo, F., et al. (2020). EZHIP is a specific diagnostic biomarker for posterior fossa ependymomas, group PFA and diffuse midline gliomas H3-WT with EZHIP overexpression. acta neuropathol commun 8, 183. 10.1186/s40478-020-01056-8.
146.
Rosenthal, R., McGranahan, N., Herrero, J., Taylor, B.S., and Swanton, C. (2016). deconstructSigs: delineating mutational processes in single tumors distinguishes DNA repair deficiencies and patterns of carcinoma evolution. Genome Biol 17, 31. 10.1186/s13059-016-0893-4.
147.
Burel‐Vandenbos, F., Pierron, G., Thomas, C., Reynaud, S., Gregoire, V., Duhil de Benaze, G., Croze, S., Chivoret, N., Honavar, M., Figarella‐Branger, D., et al. (2020). A polyphenotypic malignant paediatric brain tumour presenting a MN1‐PATZ1 fusion, no epigenetic similarities with CNS High‐Grade Neuroepithelial Tumour with MN1 Alteration (CNS HGNET‐MN1) and related to PATZ1‐fused sarcomas. Neuropathol Appl Neurobiol 46, 506–509. 10.1111/nan.12626.
148.
Kram, D.E., Henderson, J.J., Baig, M., Chakraborty, D., Gardner, M.A., Biswas, S., and Khatua, S. (2018). Embryonal Tumors of the Central Nervous System in Children: The Era of Targeted Therapeutics. Bioengineering (Basel) 5, 78. 10.3390/bioengineering5040078.
149.
Rao, S., Rajeswarie, R.T., Chickabasaviah Yasha, T., Nandeesh, B.N., Arivazhagan, A., and Santosh, V. (2017). LIN28A, a sensitive immunohistochemical marker for Embryonal Tumor with Multilayered Rosettes (ETMR), is also positive in a subset of Atypical Teratoid/Rhabdoid Tumor (AT/RT). Childs Nerv Syst 33, 1953–1959. 10.1007/s00381-017-3551-6.
Miele, E., De Vito, R., Ciolfi, A., Pedace, L., Russo, I., De Pasquale, M.D., Di Giannatale, A., Crocoli, A., Angelis, B.D., Tartaglia, M., et al. (2020). DNA Methylation Profiling for Diagnosing Undifferentiated Sarcoma with Capicua Transcriptional Receptor (CIC) Alterations. IJMS 21, 1818. 10.3390/ijms21051818.
152.
Korshunov, A., Ryzhova, M., Jones, D.T.W., Northcott, P.A., van Sluis, P., Volckmann, R., Koster, J., Versteeg, R., Cowdrey, C., Perry, A., et al. (2012). LIN28A immunoreactivity is a potent diagnostic marker of embryonal tumor with multilayered rosettes (ETMR). Acta Neuropathol 124, 875–881. 10.1007/s00401-012-1068-3.
153.
Rustagi, N., Hampton, O.A., Li, J., Xi, L., Gibbs, R.A., Plon, S.E., Kimmel, M., and Wheeler, D.A. (2016). ITD assembler: an algorithm for internal tandem duplication discovery from short-read sequencing data. BMC Bioinformatics 17, 188. 10.1186/s12859-016-1031-8.
154.
Mohila, C.A., Rauch, R.A., and Adesina, A.M. (2016). Central Neurocytoma and Extraventricular Neurocytoma. In Atlas of Pediatric Brain Tumors (Springer International Publishing), pp. 195–199. 10.1007/978-3-319-33432-5_20.
155.
Crotty, T.B., Scheithauer, B.W., Young, W.F., Davis, D.H., Shaw, E.G., Miller, G.M., and Burger, P.C. (1995). Papillary craniopharyngioma: a clinicopathological study of 48 cases. Journal of Neurosurgery 83, 206–214. 10.3171/jns.1995.83.2.0206.
156.
Bunin, G.R., Surawicz, T.S., Witman, P.A., Preston-Martin, S., Davis, F., and Bruner, J.M. (1998). The descriptive epidemiology of craniopharyngioma. Journal of Neurosurgery 89, 547–551. 10.3171/jns.1998.89.4.0547.
157.
Chang, M.T., Bhattarai, T.S., Schram, A.M., Bielski, C.M., Donoghue, M.T.A., Jonsson, P., Chakravarty, D., Phillips, S., Kandoth, C., Penson, A., et al. (2018). Accelerating Discovery of Functional Mutant Alleles in Cancer. Cancer Discovery 8, 174–183. 10.1158/2159-8290.cd-17-0321.
158.
Chang, M.T., Asthana, S., Gao, S.P., Lee, B.H., Chapman, J.S., Kandoth, C., Gao, J., Socci, N.D., Solit, D.B., Olshen, A.B., et al. (2015). Identifying recurrent mutations in cancer reveals widespread lineage diversity and mutational specificity. Nat Biotechnol 34, 155–163. 10.1038/nbt.3391.
159.
Harms, K.L., and Chen, X. (2006). The functional domains in p53 family proteins exhibit both common and distinct properties. Cell Death Differ 13, 890–897. 10.1038/sj.cdd.4401904.
160.
Guha, T., and Malkin, D. (2017). Inherited TP53 Mutations and the Li–Fraumeni Syndrome. Cold Spring Harb Perspect Med 7, a026187. 10.1101/cshperspect.a026187.
161.
Li, H., Handsaker, B., Wysoker, A., Fennell, T., Ruan, J., Homer, N., Marth, G., Abecasis, G., Durbin, R. (2009). The Sequence Alignment/Map format and SAMtools. Bioinformatics 25, 2078–2079. 10.1093/bioinformatics/btp352.
162.
Kaplan, E.L., and Meier, P. (1958). Nonparametric Estimation from Incomplete Observations. Journal of the American Statistical Association 53, 457–481. 10.2307/2281868.
Cox, D.R. (1972). Regression Models and Life-Tables. Journal of the Royal Statistical Society: Series B (Methodological) 34, 187–202. 10.1111/j.2517-6161.1972.tb00899.x.
 0000-0002-6224-0347
·
0000-0002-6224-0347
·  jashapiro
·
jashapiro
·  jashapiro