Allegra G. Hawkins 0000-0001-6026-3660
· allyhawkins
Childhood Cancer Data Lab, Alex’s Lemonade Stand Foundation, Bala Cynwyd, PA, 19004, USA
· Funded by Alex’s Lemonade Stand Foundation Childhood Cancer Data Lab (CCDL)
Joshua A. Shapiro 0000-0002-6224-0347
· jashapiro
Childhood Cancer Data Lab, Alex’s Lemonade Stand Foundation, Bala Cynwyd, PA, 19004, USA
· Funded by Alex’s Lemonade Stand Foundation Childhood Cancer Data Lab (CCDL)
Stephanie J. Spielman 0000-0002-9090-4788
· sjspielman
Childhood Cancer Data Lab, Alex’s Lemonade Stand Foundation, Bala Cynwyd, PA, 19004, USA
· Funded by Alex’s Lemonade Stand Foundation Childhood Cancer Data Lab (CCDL)
David S. Mejia 0000-0003-1679-0353
· davidsmejia
Childhood Cancer Data Lab, Alex’s Lemonade Stand Foundation, Bala Cynwyd, PA, 19004, USA
· Funded by Alex’s Lemonade Stand Foundation Childhood Cancer Data Lab (CCDL)
Deepashree Venkatesh Prasad 0000-0001-5756-4083
· dvenprasad
Childhood Cancer Data Lab, Alex’s Lemonade Stand Foundation, Bala Cynwyd, PA, 19004, USA
· Funded by Alex’s Lemonade Stand Foundation Childhood Cancer Data Lab (CCDL)
Nozomi Ichihara
· nozomione
Childhood Cancer Data Lab, Alex’s Lemonade Stand Foundation, Bala Cynwyd, PA, 19004, USA
· Funded by Alex’s Lemonade Stand Foundation Childhood Cancer Data Lab (CCDL)
Arkadii Yakovets
· arkid15r
Childhood Cancer Data Lab, Alex’s Lemonade Stand Foundation, Bala Cynwyd, PA, 19004, USA
· Funded by Alex’s Lemonade Stand Foundation Childhood Cancer Data Lab (CCDL)
Avrohom M. Gottlieb
· avrohomgottlieb
Childhood Cancer Data Lab, Alex’s Lemonade Stand Foundation, Bala Cynwyd, PA, 19004, USA
· Funded by Alex’s Lemonade Stand Foundation Childhood Cancer Data Lab (CCDL)
Kurt G. Wheeler
· kurtwheeler
Childhood Cancer Data Lab, Alex’s Lemonade Stand Foundation, Bala Cynwyd, PA, 19004, USA
· Funded by Alex’s Lemonade Stand Foundation Childhood Cancer Data Lab (CCDL)
Chante J. Bethell 0000-0001-9653-8128
· cbethell
Childhood Cancer Data Lab, Alex’s Lemonade Stand Foundation, Bala Cynwyd, PA, 19004, USA; The University of Texas MD Anderson Cancer Center, UTHealth Houston Graduate School of Biomedical Sciences, Houston, TX, 77030, USA
· Funded by Alex’s Lemonade Stand Foundation Childhood Cancer Data Lab (CCDL)
Steven M. Foltz 0000-0002-9526-8194
· envest
Childhood Cancer Data Lab, Alex’s Lemonade Stand Foundation, Bala Cynwyd, PA, 19004, USA; Department of Pediatrics, Division of Oncology, Children’s Hospital of Philadelphia, Philadelphia, PA, 19104, USA
· Funded by Alex’s Lemonade Stand Foundation Childhood Cancer Data Lab (CCDL)
Jennifer O’Malley
· Jen-OMalley
Childhood Cancer Data Lab, Alex’s Lemonade Stand Foundation, Bala Cynwyd, PA, 19004, USA
· Funded by Alex’s Lemonade Stand Foundation Childhood Cancer Data Lab (CCDL)
Casey S. Greene 0000-0001-8713-9213
· cgreene
Childhood Cancer Data Lab, Alex’s Lemonade Stand Foundation, Bala Cynwyd, PA, 19004, USA; Center for Health AI, University of Colorado School of Medicine, Aurora, CO, 80045, USA; Department of Biomedical Informatics, University of Colorado School of Medicine, Aurora, CO, 80045, USA
· Funded by Alex’s Lemonade Stand Foundation Childhood Cancer Data Lab (CCDL)
Jaclyn N. Taroni✉ 0000-0003-4734-4508
· jaclyn-taroni
Childhood Cancer Data Lab, Alex’s Lemonade Stand Foundation, Bala Cynwyd, PA, 19004, USA
· Funded by Alex’s Lemonade Stand Foundation Childhood Cancer Data Lab (CCDL)
✉ — Correspondence possible via GitHub Issues
or email to
Jaclyn N. Taroni <jaclyn.taroni@ccdatalab.org>.
Abstract
The Single-cell Pediatric Cancer Atlas (ScPCA) Portal (https://scpca.alexslemonade.org/) is a data resource for uniformly processed single-cell and single-nuclei RNA sequencing (RNA-seq) data and de-identified metadata from pediatric tumor samples.
Originally comprised of data from 10 projects funded by Alex’s Lemonade Stand Foundation (ALSF), the Portal currently contains summarized gene expression data for over 700 samples across 55 cancer types from ALSF-funded and community-contributed datasets.
Downloads include gene expression data as SingleCellExperiment or AnnData objects containing raw and normalized counts, PCA and UMAP coordinates, automated cell type annotations, and copy-number variation estimates, along with summary reports.
Some samples have additional data from bulk RNA-seq, spatial transcriptomics, and/or feature barcoding (e.g., CITE-seq and cell hashing) included in the download.
All data on the Portal were uniformly processed using scpca-nf, an efficient and open-source Nextflow workflow that uses alevin-fry to quantify gene expression.
Comprehensive documentation, including descriptions of file contents and a guide to getting started, is available at https://scpca.readthedocs.io.
Introduction
The number of studies employing single-cell RNA-seq has grown rapidly since this technology was introduced [1].
Unlike its predecessor bulk RNA-seq, which averages the expression profiles of all cells within a sample, single-cell technology quantifies gene expression in individual cells.
Tumors are known to be transcriptionally heterogeneous, which highlights the importance of using single-cell RNA-seq in studying tumor samples [2].
Researchers can use single-cell RNA-seq data of samples obtained from patient tumors to analyze and identify individual cell populations that may play important roles in tumor growth, resistance, and metastasis [3].
Additionally, single-cell RNA-seq data provides insight into how tumor cells interact with normal cells in the tumor microenvironment [4].
With the growing number of single-cell RNA-seq datasets, efforts have emerged to create centralized data resources.
For example, resources like CELLxGENE [5,6] offer gene expression data from samples spanning hundreds of cell types in standardized analysis formats.
Other resources offer harmonized data, enabling reliable cross-sample comparisons spanning diverse biological contexts to complete their analysis and elucidate previously unknown similarities across samples and disease types.
The Human Cell Atlas (HCA) and Human Tumor Atlas Network (HTAN) are two of many such resources.
The HCA, which aims to provide a comprehensive map of all cell types in the human body using single-cell genomics, contains uniformly processed single-cell RNA-seq data obtained from normal tissue with few samples derived from diseased tissue [7].
The HTAN also hosts a collection of genomic data collected from tumors across multiple cancer types, including single-cell RNA-seq [8].
While existing resources have focused on making large quantities of harmonized data from normal tissue or adult tumor samples available, there are considerably fewer efforts to harmonize and distribute data from pediatric tumors.
Pediatric cancer is much less common than adult cancer, so the number of available samples from pediatric tumors is smaller compared to the number of adult tumors [9] and access to data from pediatric tumors is often limited.
Recently, Xu and colleagues highlighted the lack of standardization of pediatric cancer single-cell data as a barrier to reuse and their attempt to create an atlas [10].
Thus, it is imperative to provide harmonized data from pediatric tumors to all pediatric cancer researchers [11].
To address this unmet need, Alex’s Lemonade Stand Foundation and the Childhood Cancer Data Lab developed and maintain the Single-cell Pediatric Cancer Atlas (ScPCA) Portal (https://scpca.alexslemonade.org/), a data resource for single-cell and single-nuclei RNA-seq data of pediatric tumor samples.
The ScPCA Portal holds uniformly processed summarized gene expression from 10x Genomics droplet-based single-cell and single-nuclei RNA-seq for over 700 samples from a diverse set of 55 types of pediatric cancers.
Originally comprised of data from 10 projects funded by Alex’s Lemonade Stand Foundation, the Portal has since expanded to include data contributed by pediatric cancer research community members.
In addition to gene expression data from single-cell and single-nuclei RNA-seq, the Portal includes data obtained from bulk RNA-seq, spatial transcriptomics, and feature barcoding methods such as CITE-seq and cell hashing.
All data on the Portal are available in formats ready for downstream analysis with common workflow ecosystems, including SingleCellExperiment objects used by R/Bioconductor[12] or AnnData objects used by Scanpy and related Python modules [13].
Downloaded objects contain both raw and normalized gene expression counts, dimensionality reduction results, cell type annotations, and copy-number variation estimates.
As of January 2026, over 900 unique downloaders have accessed the Portal since its launch.
To ensure that all current and future data on the Portal are uniformly processed, we created scpca-nf, an open-source Nextflow [14] pipeline (https://github.com/AlexsLemonade/scpca-nf).
This consistent pipeline increases transparency and allows users to perform analysis across multiple samples and projects without re-processing.
The scpca-nf workflow uses alevin-fry[15] for fast and efficient quantification of single-cell gene expression for all samples on the Portal, including single-cell RNA-seq data and any associated CITE-seq or cell hash data.
The scpca-nf pipeline also serves as a resource, allowing researchers to process their own samples for comparison to Portal data and to submit community contributions to the Portal.
Here, we present the Single-cell Pediatric Cancer Atlas as a freely-available resource for all pediatric cancer researchers.
The ScPCA Portal provides downloads ready for immediate use, allowing researchers to skip time-consuming data re-processing and wrangling steps.
We provide comprehensive documentation about data processing and the contents of files on the Portal, including a guide to getting started working with an ScPCA dataset (https://scpca.readthedocs.io/).
The ScPCA Portal advances pediatric cancer research by accelerating researchers’ ability to answer important biological questions.
Results
The Single-cell Pediatric Cancer Atlas Portal
In March of 2022, the Childhood Cancer Data Lab launched the Single-cell Pediatric Cancer Atlas (ScPCA) Portal to make uniformly processed, summarized single-cell and single-nuclei RNA-seq data and de-identified metadata from pediatric tumor samples openly available for download by the research community.
Data available on the Portal was obtained using two different mechanisms: raw data was accepted from ALSF-funded investigators and processed using our open-source pipeline scpca-nf, or investigators processed their raw data using scpca-nf and submitted the output for inclusion on the Portal.
All samples on the Portal include a core set of metadata obtained from investigators, including age, sex, diagnosis, subdiagnosis (if applicable), tissue location, and disease stage.
The majority of projects include additional metadata, such as treatment or tumor stage, if provided by submitters.
We standardized all provided metadata to maintain consistency across projects before adding it to the Portal.
Where applicable, we include ontology term identifiers in addition to human-readable values.
We use ontology term identifiers obtained from HsapDv (age) [16], PATO (sex) [17,18], NCBI taxonomy (organism) [19,20], MONDO (disease) [21,22], UBERON (tissue) [23,24,25], and Hancestro (ethnicity, if applicable) [26,27].
These ontology term identifiers standardize metadata terms and facilitate comparisons among datasets within the Portal and other research projects.
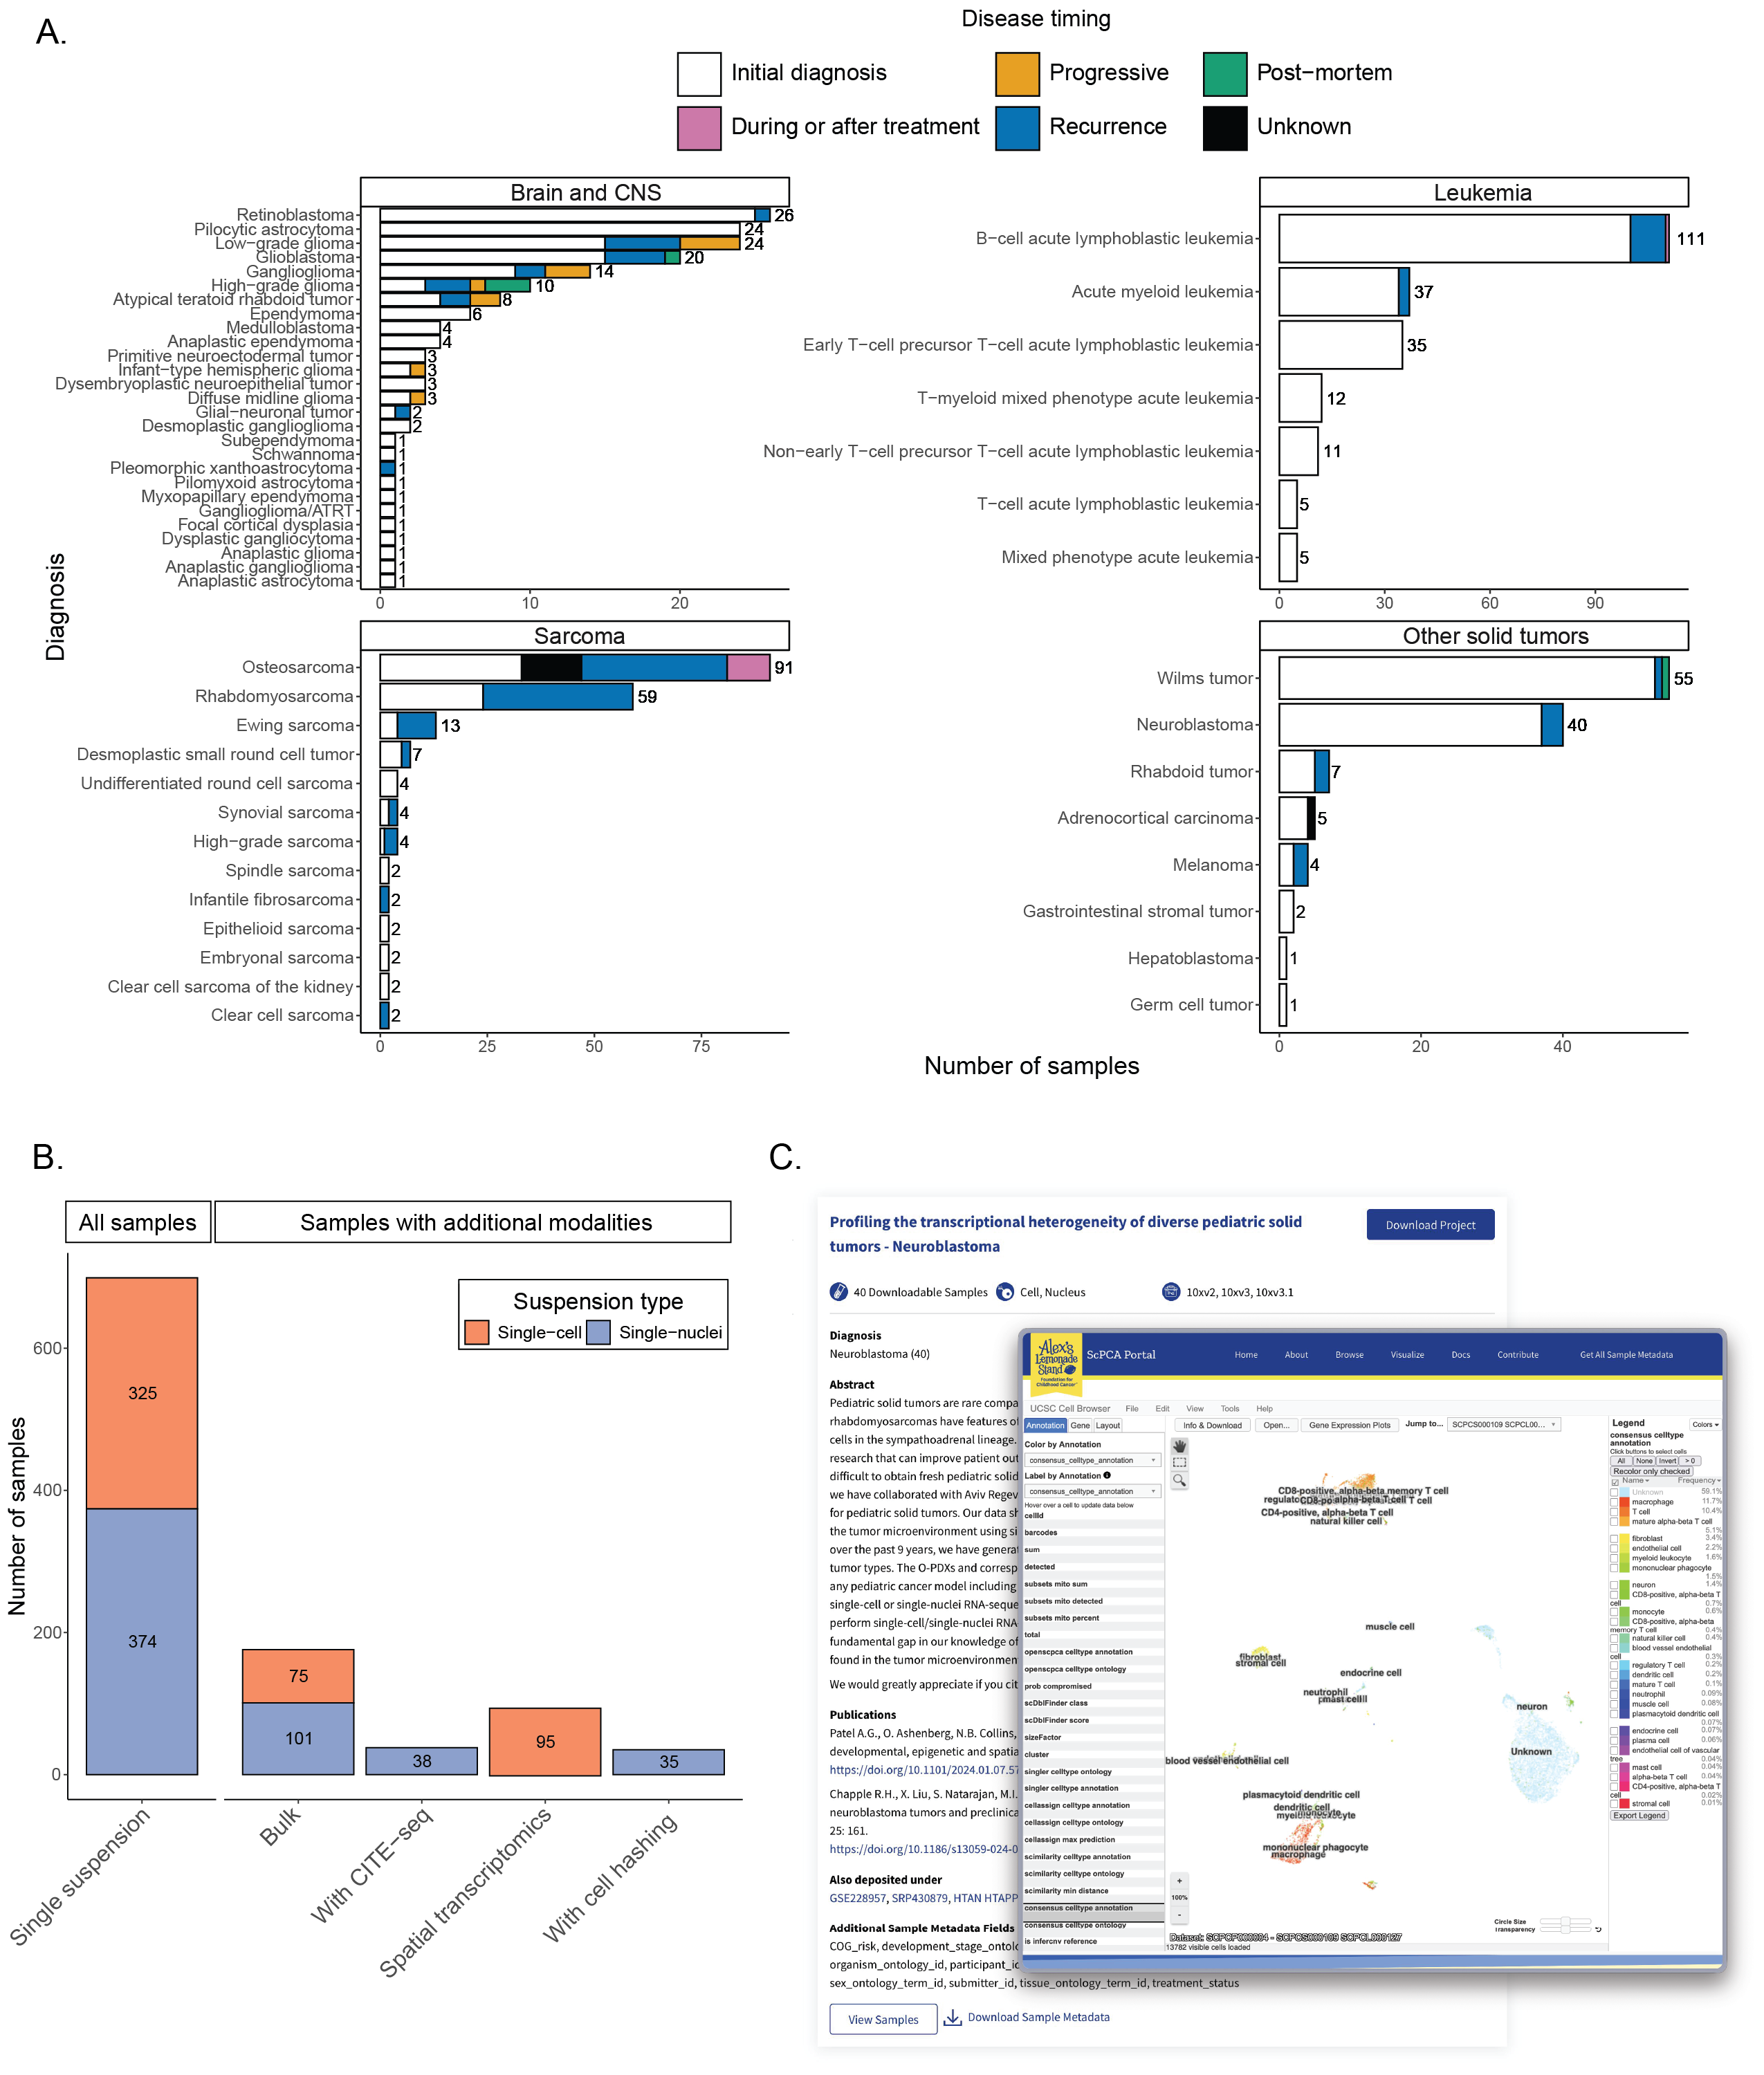
The Portal contains data from over 700 samples and 55 tumor types [28,29,30,31,32,33,34].
Figure 1A summarizes all samples from patient tumors and patient-derived xenografts currently available on the Portal.
The largest number of samples on the Portal were obtained from patients with leukemia (n = 216).
The Portal also includes samples from sarcoma and soft tissue tumors (n = 194), brain and central nervous system tumors (n = 167), and a variety of other solid tumors (n = 115).
Most samples were collected at initial diagnosis (n = 520), with a smaller number of samples collected at recurrence (n = 129), during progressive disease (n = 12), during or after treatment (n = 11), or post-mortem (n = 5).
Along with the patient tumors, the Portal contains a small number of human tumor cell line samples (n = 6) and non-cancerous samples (n = 6).
Sample data includes summarized gene expression data from either single-cell or single-nuclei RNA sequencing, obtained using the 10x Genomics droplet-based platform.
Some samples also include additional data, such as CITE-seq quantification of cell-surface protein levels with antibody-derived tags (ADT) [35], or hashtag oligonucleotide (HTO) quantification for samples multiplexed prior to sequencing [36].
Raw FASTQ files are not available for download from the Portal, but we direct users to raw data sources via links to external repositories, such as the Database of Genotypes and Phenotypes (dbGaP) [37,38], when available.
Out of the 704 samples, 95 have associated CITE-seq data, and 35 have associated multiplexing data.
In some cases, multiple libraries from the same sample were created for additional assays, either for bulk RNA-seq (n = 182) or spatial transcriptomics (n = 41).
A small number of samples in the Portal (n = 7) have only bulk RNA-seq or spatial transcriptomics data.
A summary of the number of single-cell or single-nuclei samples and their associated additional modalities is shown in Figure 1B, and a detailed summary of the total samples with each sequencing method broken down by project is available in Table S1.
Samples on the Portal are organized by project, where each project is a collection of similar samples from an individual lab.
Users can filter projects based on diagnosis, included modalities (e.g., CITE-seq, bulk RNA-seq), 10x Genomics kit version (e.g., 10Xv2, 10Xv3), and whether or not a project includes samples derived from patient-derived xenografts or cell lines.
The project card displays an abstract, the total number of samples included, a list of diagnoses for all samples included in the Project, and links to any external information associated with the project, such as publications and links to external data, such as SRA or GEO (Figure 1C).
The project card also indicates the type(s) of sequencing performed, including the 10x Genomics kit version, the suspension type (cell or nucleus), if additional sequencing like bulk RNA-seq is present, or if the samples have been multiplexed using cell hashing.
The Portal also provides for visualization of individual samples via the UCSC Cell Browser interface [39] as seen in Figure 1C.
Interactive UMAPs allow users to explore the cells within each sample, coloring by cell type annotations, gene expression values, or other calculated metrics.
Uniform processing of data available on the ScPCA Portal
We developed scpca-nf, an open-source and efficient Nextflow [14] workflow for quantifying single-cell and single-nuclei RNA-seq data and processed all data available on the Portal with it.
Nextflow is a workflow management system that allows users to execute multi-step and long-running bioinformatics processes in a portable and reproducible manner across various computing environments, including high-performance computing clusters and cloud-based computing [40].
Nextflow allows seamless management of all dependencies, as each process in the workflow can be run using a specified container image.
This flexibility and containerization make the workflow easily portable for external use.
Setup requires only installing Nextflow and a supported container engine, managing a single configuration file for the computing environment, and organizing input files.
When building scpca-nf, we sought a fast and memory-efficient tool for gene expression quantification to minimize processing costs.
Due to its popularity, we expected many Portal users to process their own single-cell or single-nuclei data with Cell Ranger [41,42].
Thus, selecting a tool with comparable results to Cell Ranger was also desirable.
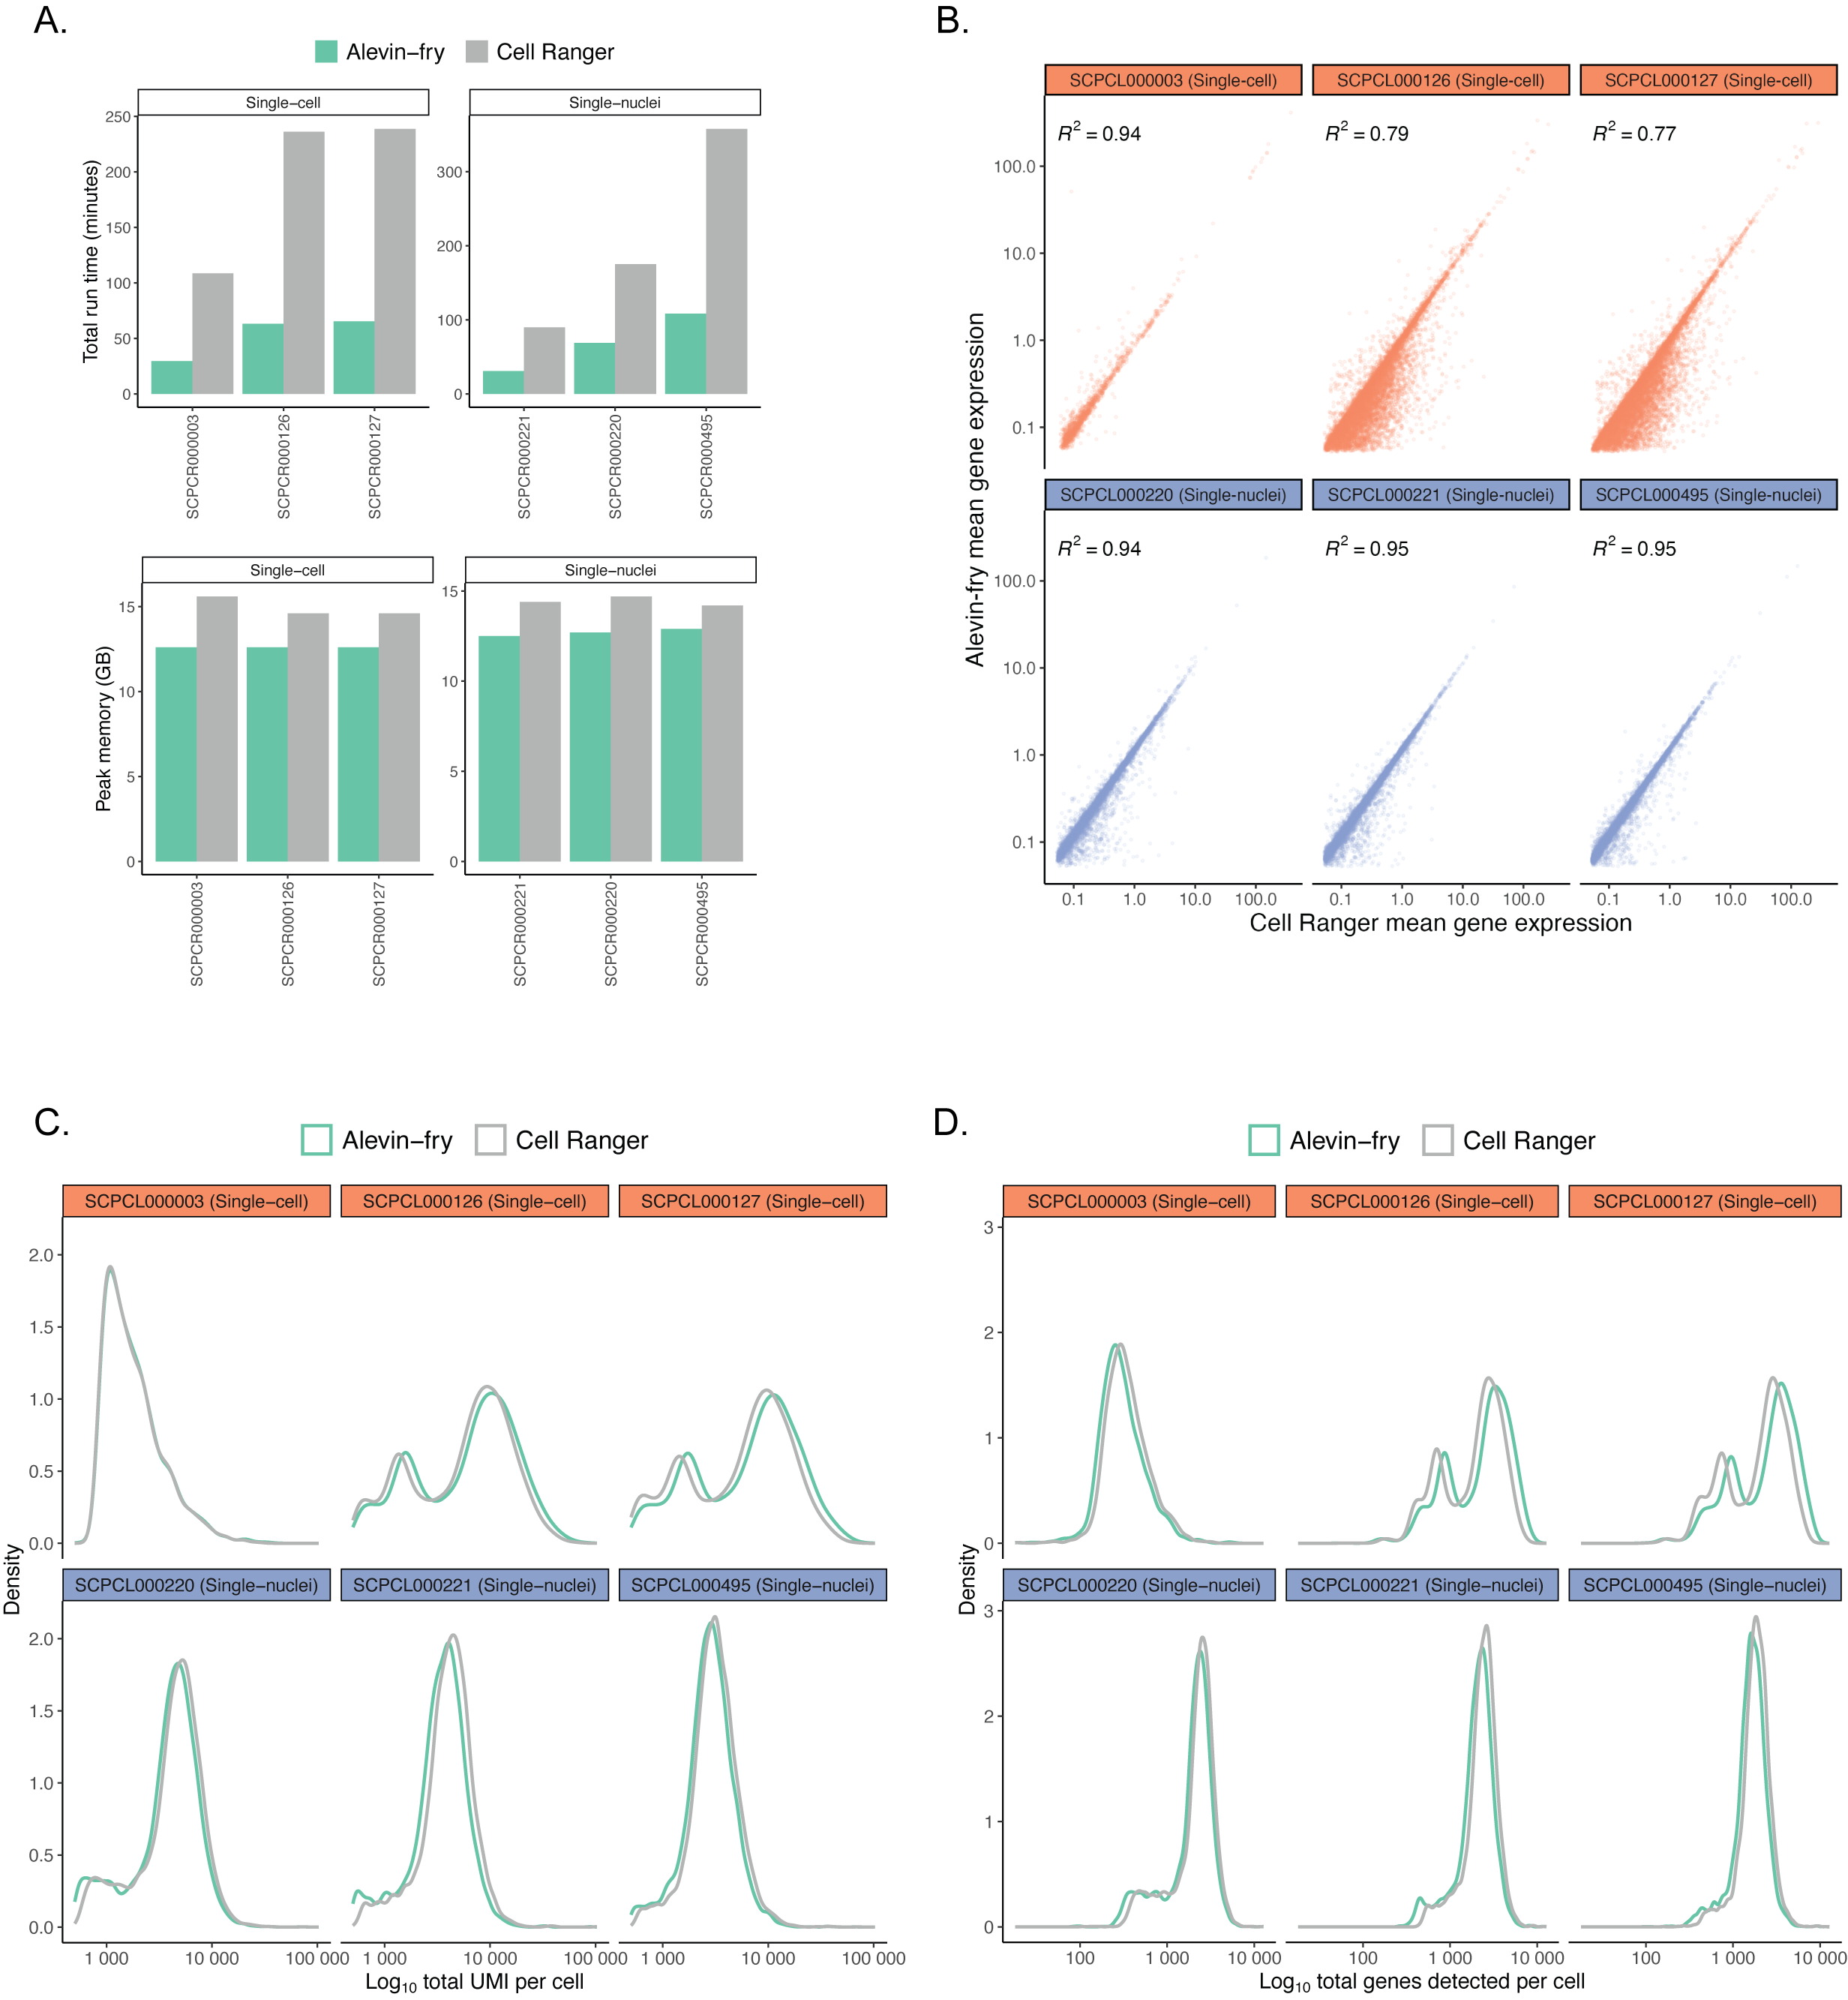
In comparing alevin-fry[15] to Cell Ranger, we found alevin-fry had a lower run time and memory usage (Figure S1A) while retaining comparable mean gene expression for all genes (Figure S1B), total UMIs per cell (Figure S1C), and total genes detected per cell (Figure S1D).
Based on these results, we used salmon alevin and alevin-fry[15] in scpca-nf to quantify gene expression data.
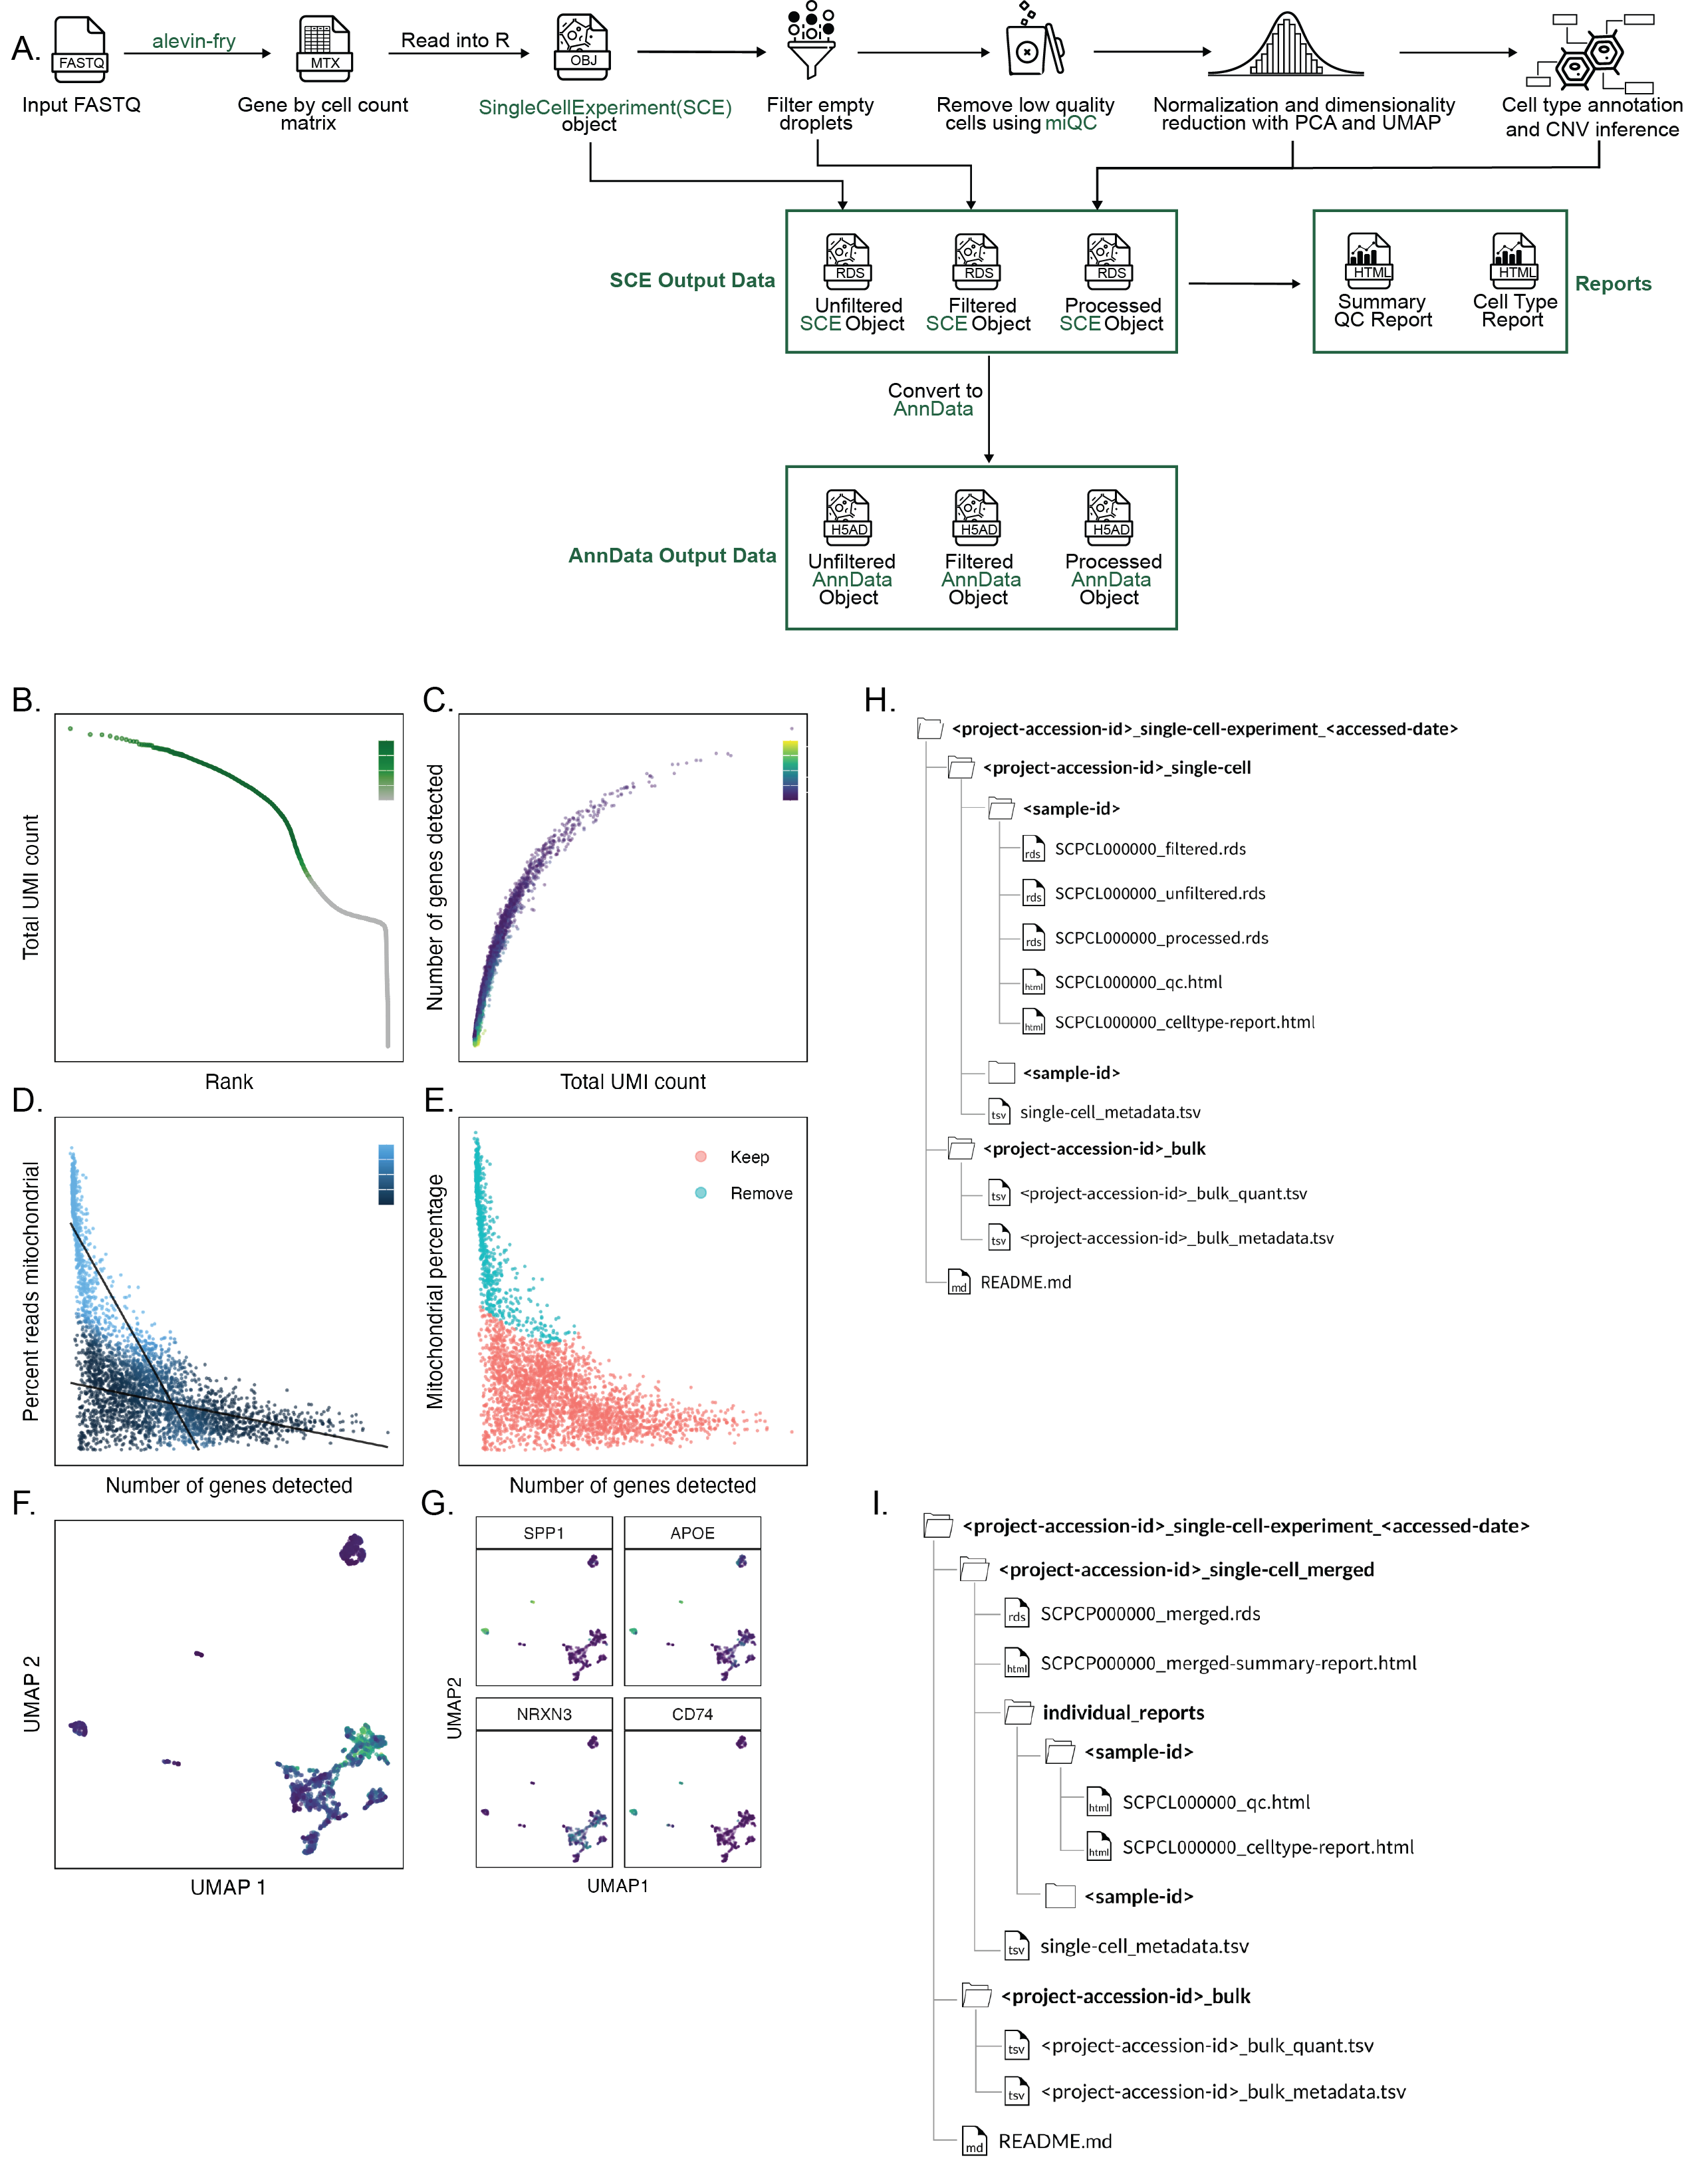
Taking FASTQ files as input, scpca-nf aligns reads using the selective alignment option in salmon alevin to an index with transcripts corresponding to spliced cDNA and intronic regions, denoted by alevin-fry as a splici index (Figure 2A).
The output from alevin-fry includes a gene-by-cell count matrix for all barcodes identified, even those that may not contain true cells.
scpca-nf performs filtering of empty droplets, removal of low-quality cells, normalization, dimensionality reduction, cell type annotation, and copy-number variation (CNV) inference (Figure 2A).
We elected to use the Bioconductor ecosystem [43,44] for filtering, normalization, and dimensionality reduction because of its rich documentation, wide use in the community, and ability to produce relatively small file sizes.
The unfiltered gene-by-cell counts matrices are filtered to remove any barcodes that are not likely to contain cells using DropletUtils::emptyDropsCellRanger()[45].
Low-quality cells are identified and removed with miQC[46], which jointly models the proportion of mitochondrial reads and detected genes per cell and calculates a probability that each cell is compromised.
The remaining cells’ counts are normalized [47], and reduced-dimension representations are calculated using both principal component analysis (PCA) and uniform manifold approximation and projection (UMAP) [48].
Cell types are classified using three automated methods: SingleR[49], CellAssign[50], and SCimilarity[51].
Finally, CNV is estimated for each cell using InferCNV[52].
To make downloading from the Portal convenient for R and Python users, downloads are available as either SingleCellExperiment or AnnData[53] objects.
The workflow outputs a SingleCellExperiment object to an .rds file containing the fully processed results, including the dimension reduction results and cell type annotations, as well as objects containing the unfiltered and the empty droplet filtered gene-by-cell matrices.
scpca-nf also converts all SingleCellExperiment objects to AnnData objects, which are saved as .h5ad files (Figure 2A).
Downloads contain the unfiltered, filtered, and processed objects from scpca-nf to allow users to choose to perform their own filtering and normalization or to start their analysis from a processed object.
Providing unfiltered raw counts is consistent with the recommendations in Xu et al. [10] for maximizing reusability when sharing pediatric cancer single-cell data.
All downloads from the Portal include a quality control (QC) report with a summary of processing information (e.g., alevin-fry version), library statistics (e.g., the total number of cells), and a collection of diagnostic plots for each library (Figure 2B-G).
A knee plot displaying total UMI counts for all droplets (i.e., including empty droplets) indicates the effects of the empty droplet filtering (Figure 2B).
For each cell that remains after filtering, the total UMI count, genes detected, and mitochondrial fraction are calculated and summarized in a scatter plot (Figure 2C).
We include plots showing the miQC model and which cells are kept and removed after filtering with miQC (Figure 2D-E).
We also provide a UMAP plot with cells colored by the number of genes detected and a faceted UMAP plot colored by the expression of a set of highly variable genes (Figure 2F-G).
Processing samples with additional modalities
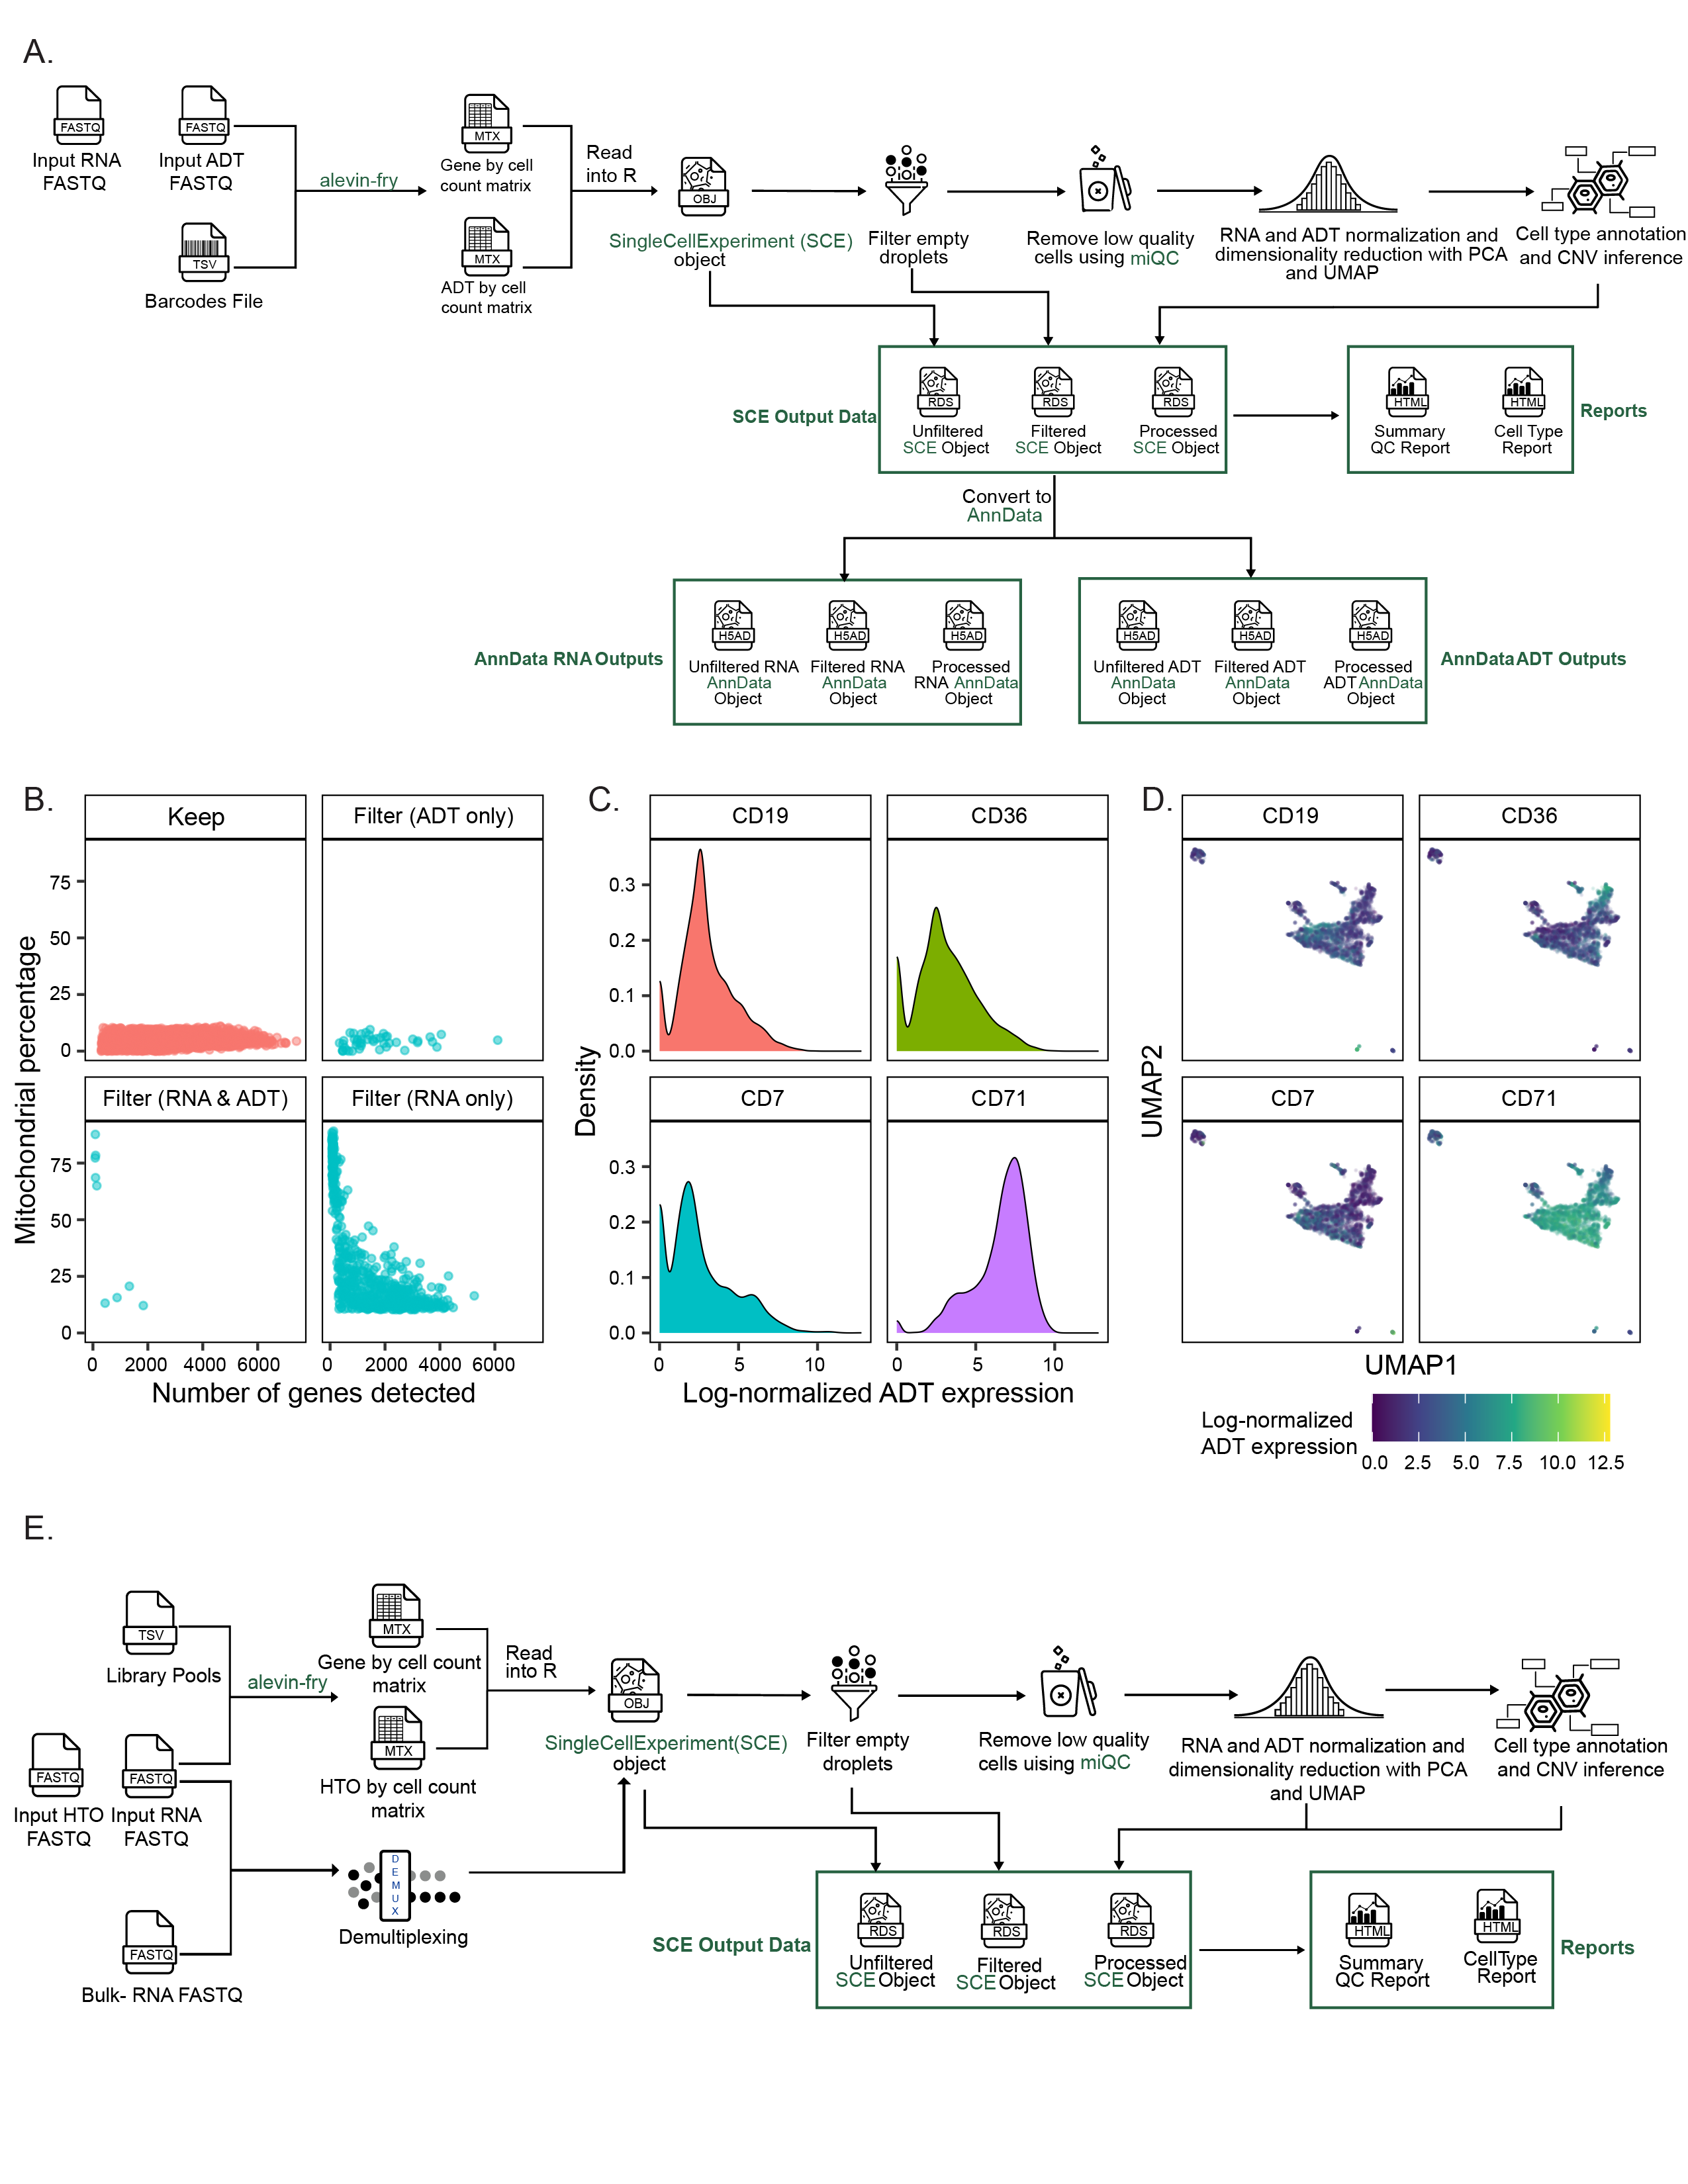
scpca-nf includes modules for processing sequencing modalities beyond single-cell or single-nuclei RNA-seq such as CITE-seq (ADT) [35], multiplexed (cell hashing) [36], spatial transcriptomics, or bulk RNA-seq.
For libraries with ADT data, the ADT reads are quantified using salmon alevin and alevin-fry (Figure S2A).
The workflow performs ADT-by-cell counts matrix normalization (see Methods for details), and calculates QC statistics that users can employ for additional filtering before downstream analysis.
For these libraries, the QC report includes additional ADT-related statistics and ADT-specific diagnostic and exploratory plots (Figure S2B-D).
For multiplexed libraries, the HTO FASTQ files are quantified using salmon alevin and alevin-fry (Figure S2E).
Although scpca-nf quantifies the HTO data and includes an HTO-by-cell counts matrix in all objects, final demultiplexing is not performed.
Instead, scpca-nf applies multiple demultiplexing methods, including demultiplexing with DropletUtils::hashedDrops()[54] and Seurat::HTODemux()[36].
When bulk RNA-seq data from constituent samples are available, genetic demultiplexing [55] is also performed.
The results from all available demultiplexing methods are saved in the filtered and processed SingleCellExperiment objects, and HTO-specific library statistics are included in the QC report.
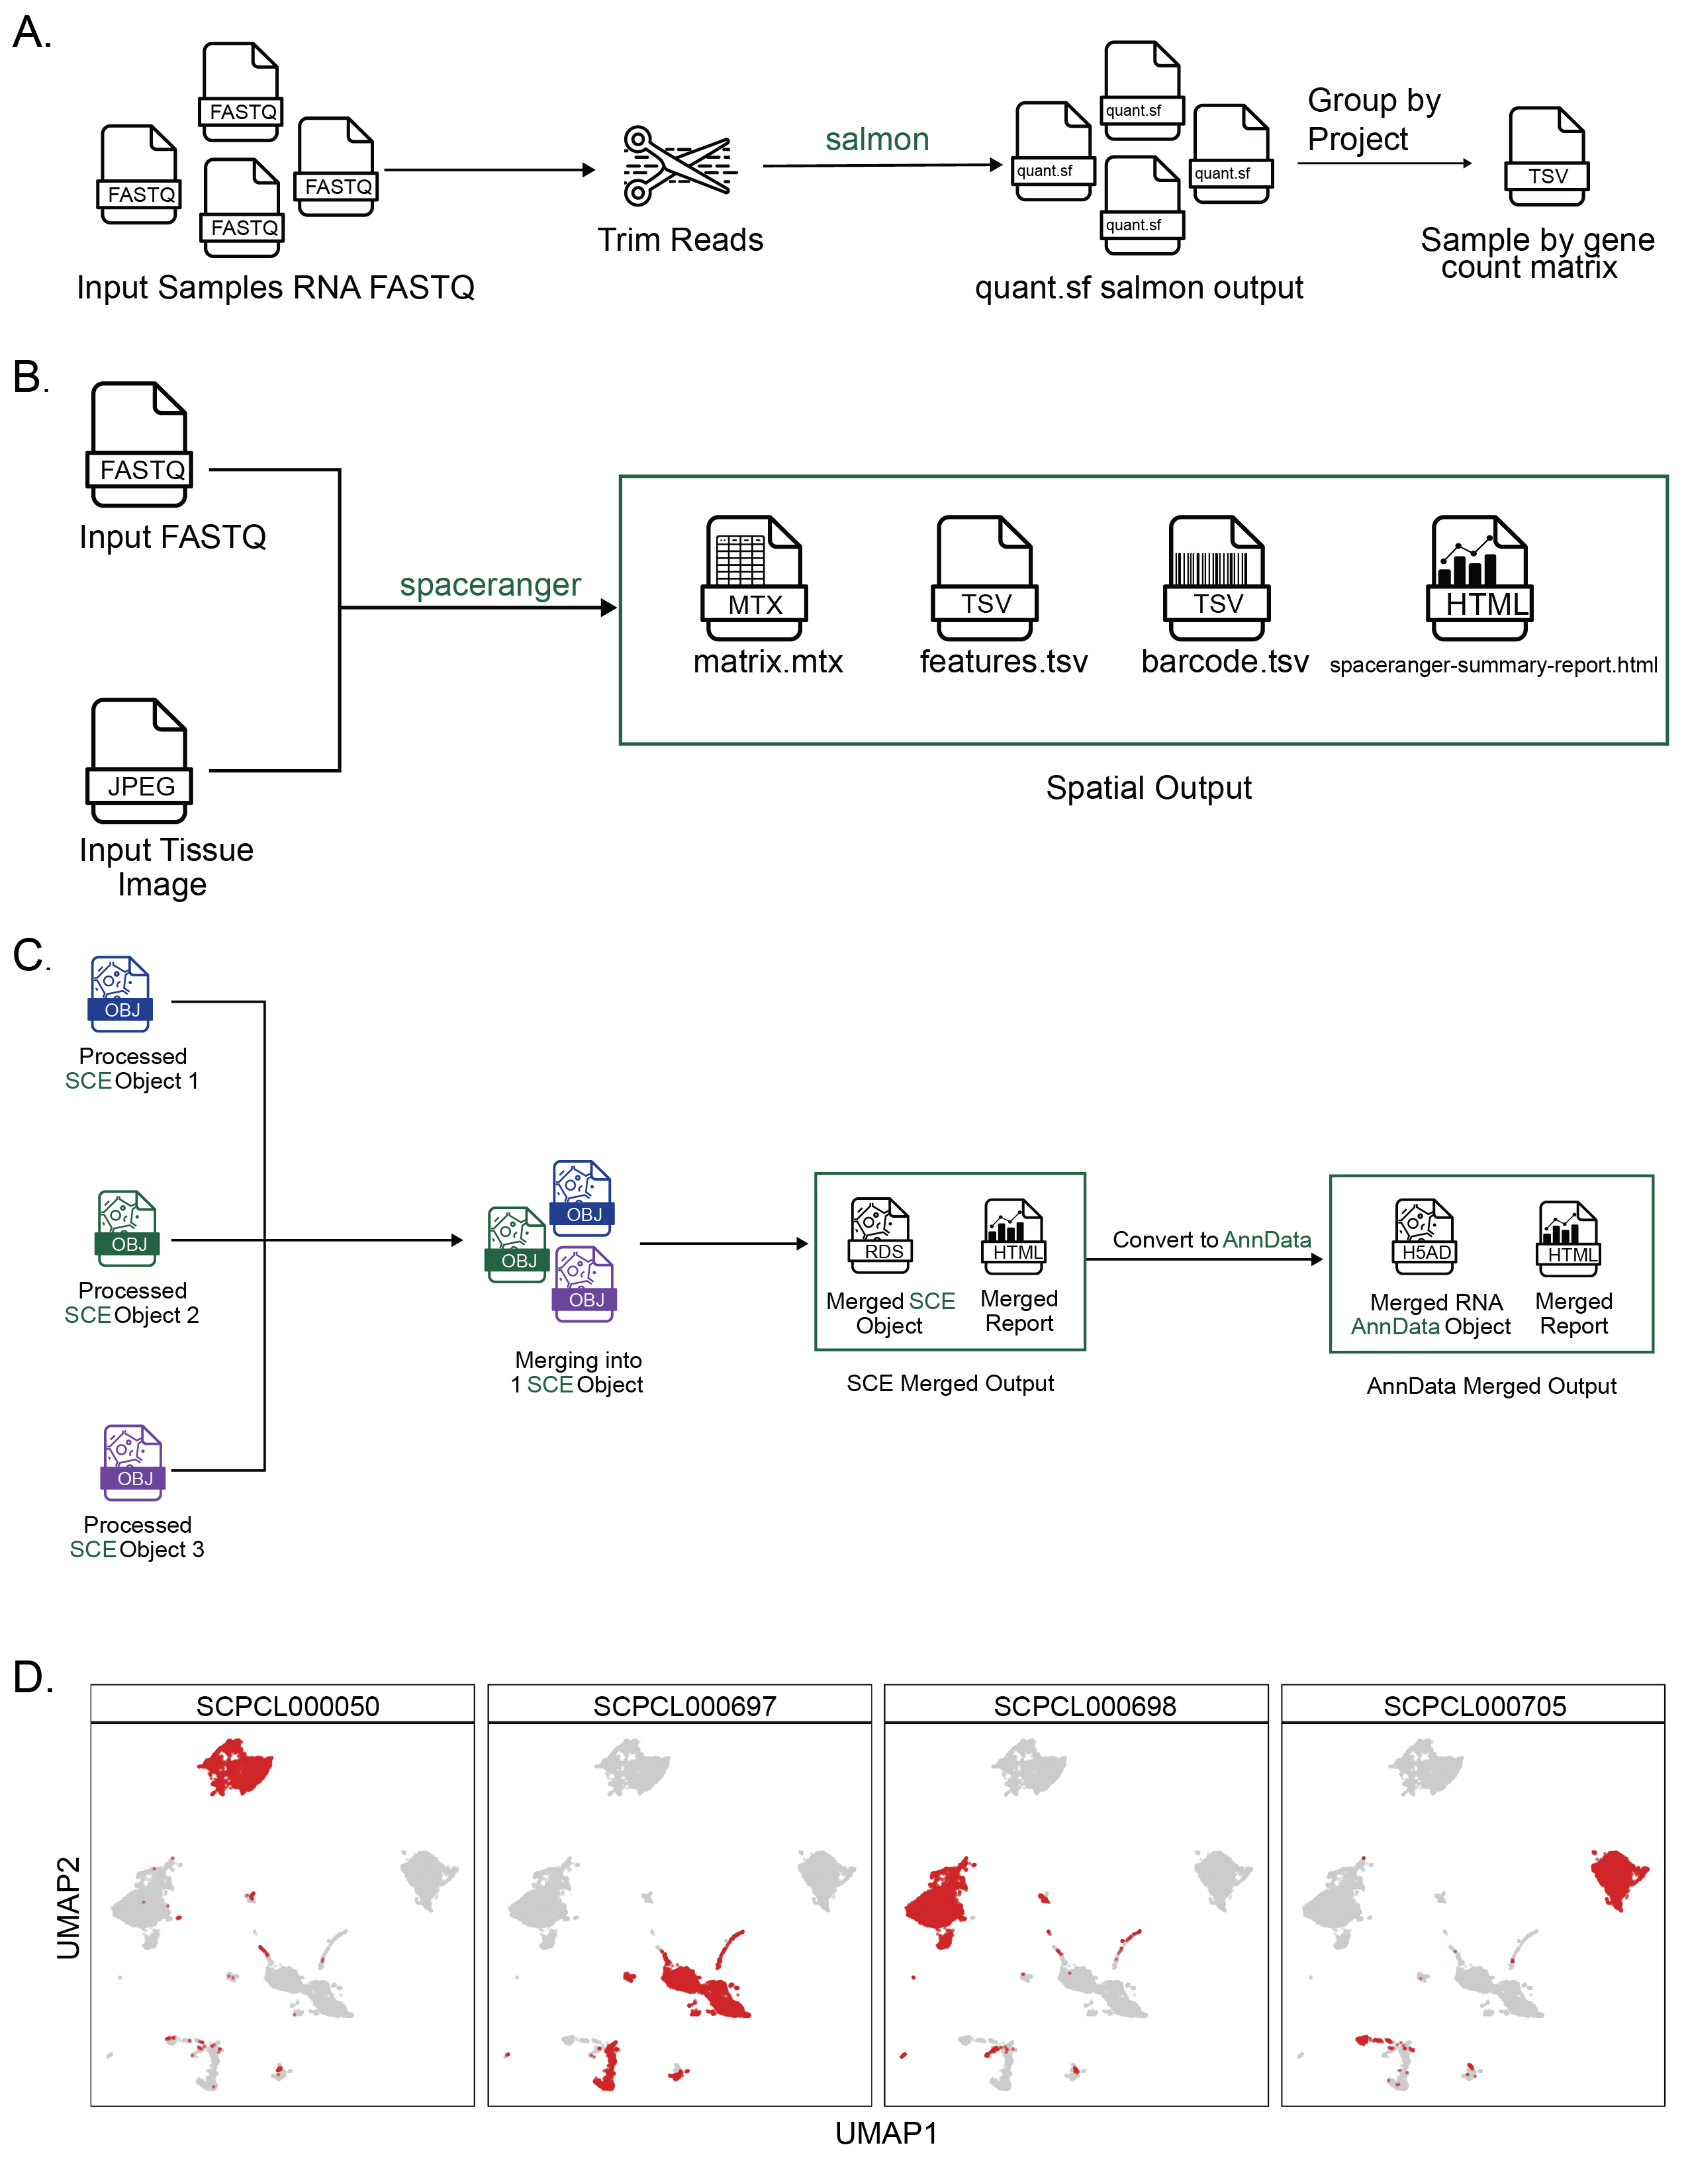
With bulk RNA-seq data, scpca-nf trims reads using fastp[56] and quantifies expression with salmon (Figure S3A) [57].
The output is a single TSV file with the gene-by-sample counts matrix for all samples in a given ScPCA project.
Spatial transcriptomics data is processed with Space Ranger [58] to quantify expression and process slide images (Figure S3B).
The output includes the spot-by-gene matrix along with a summary report produced by Space Ranger.
Downloading projects from the ScPCA Portal
On the Portal, users can download data from individual samples or all data from an ScPCA project.
When downloading data for an entire project, users can choose between receiving the individual files for each sample (default) or one file containing the gene expression data and metadata for all samples in the project as a merged object.
Users also have the option to choose their desired format and receive the data as SingleCellExperiment (.rds) or AnnData (.h5ad) objects.
In addition to the web interface, we provide an R package, ScPCAr, to allow programmatic access to metadata and files on the Portal, available at https://alexslemonade.github.io/ScPCAr/.
As of January 2026, users of the web interface can generate custom datasets by selecting specific samples from multiple projects to include in a single download.
For downloads with samples as individual files, the download folder will include a sub-folder for each sample in the project (Figure 2H).
Each sample folder contains all three object types (unfiltered, filtered, and processed) in the requested file format and the QC and cell type summary report for all libraries from the given sample.
The objects house the summarized gene expression data and associated metadata for the library indicated in the filename.
All project downloads include a metadata file, single-cell_metadata.tsv, containing relevant metadata for all samples, and a README.md with information about the contents of each download, contact and citation information, and terms of use for data downloaded from the Portal (Figure 2H-I).
If the ScPCA project includes samples with bulk RNA-seq, two additional files are included: a gene-by-sample counts matrix (_bulk_quant.tsv) with the quantified gene expression data for all samples in the project, and a metadata file (_bulk_metadata.tsv).
Merged objects
Combining data from multiple samples within a single file facilitates performing joint gene-level analyses across samples, such as differential expression or gene set enrichment analyses.
Therefore, we provide a single merged object for each ScPCA project containing all raw and normalized gene expression data and metadata for all single-cell and single-nuclei RNA-seq libraries (with some exceptions as described in the Methods) produced using our merge.nf workflow (Figure S3C).
Merged objects are not batch-corrected or integrated, so users can perform their own batch correction or integration as needed to suit their experimental designs.
When downloading the merged object for an ScPCA project, the download will include a single SingleCellExperiment or AnnData file, a summary report for the merged object, and the individual summary QC and cell type reports for each individual library (Figure 2I).
The summary report for the merged object includes a faceted UMAP showing all cells from all libraries (Figure S3D) and a set of tables summarizing the metadata for the samples and libraries included in the project.
Annotating cell types
Assigning cell type labels to single-cell and single-nuclei RNA-seq data is often an essential step in analysis.
Cell type annotation requires knowledge of the expected cell types in a dataset and associated gene expression patterns for each cell type, which may be available in other public databases or individual publications.
Automated cell type annotation methods leveraging public databases are an excellent initial step in the labeling process, as they can be applied consistently and transparently across all samples in a dataset.
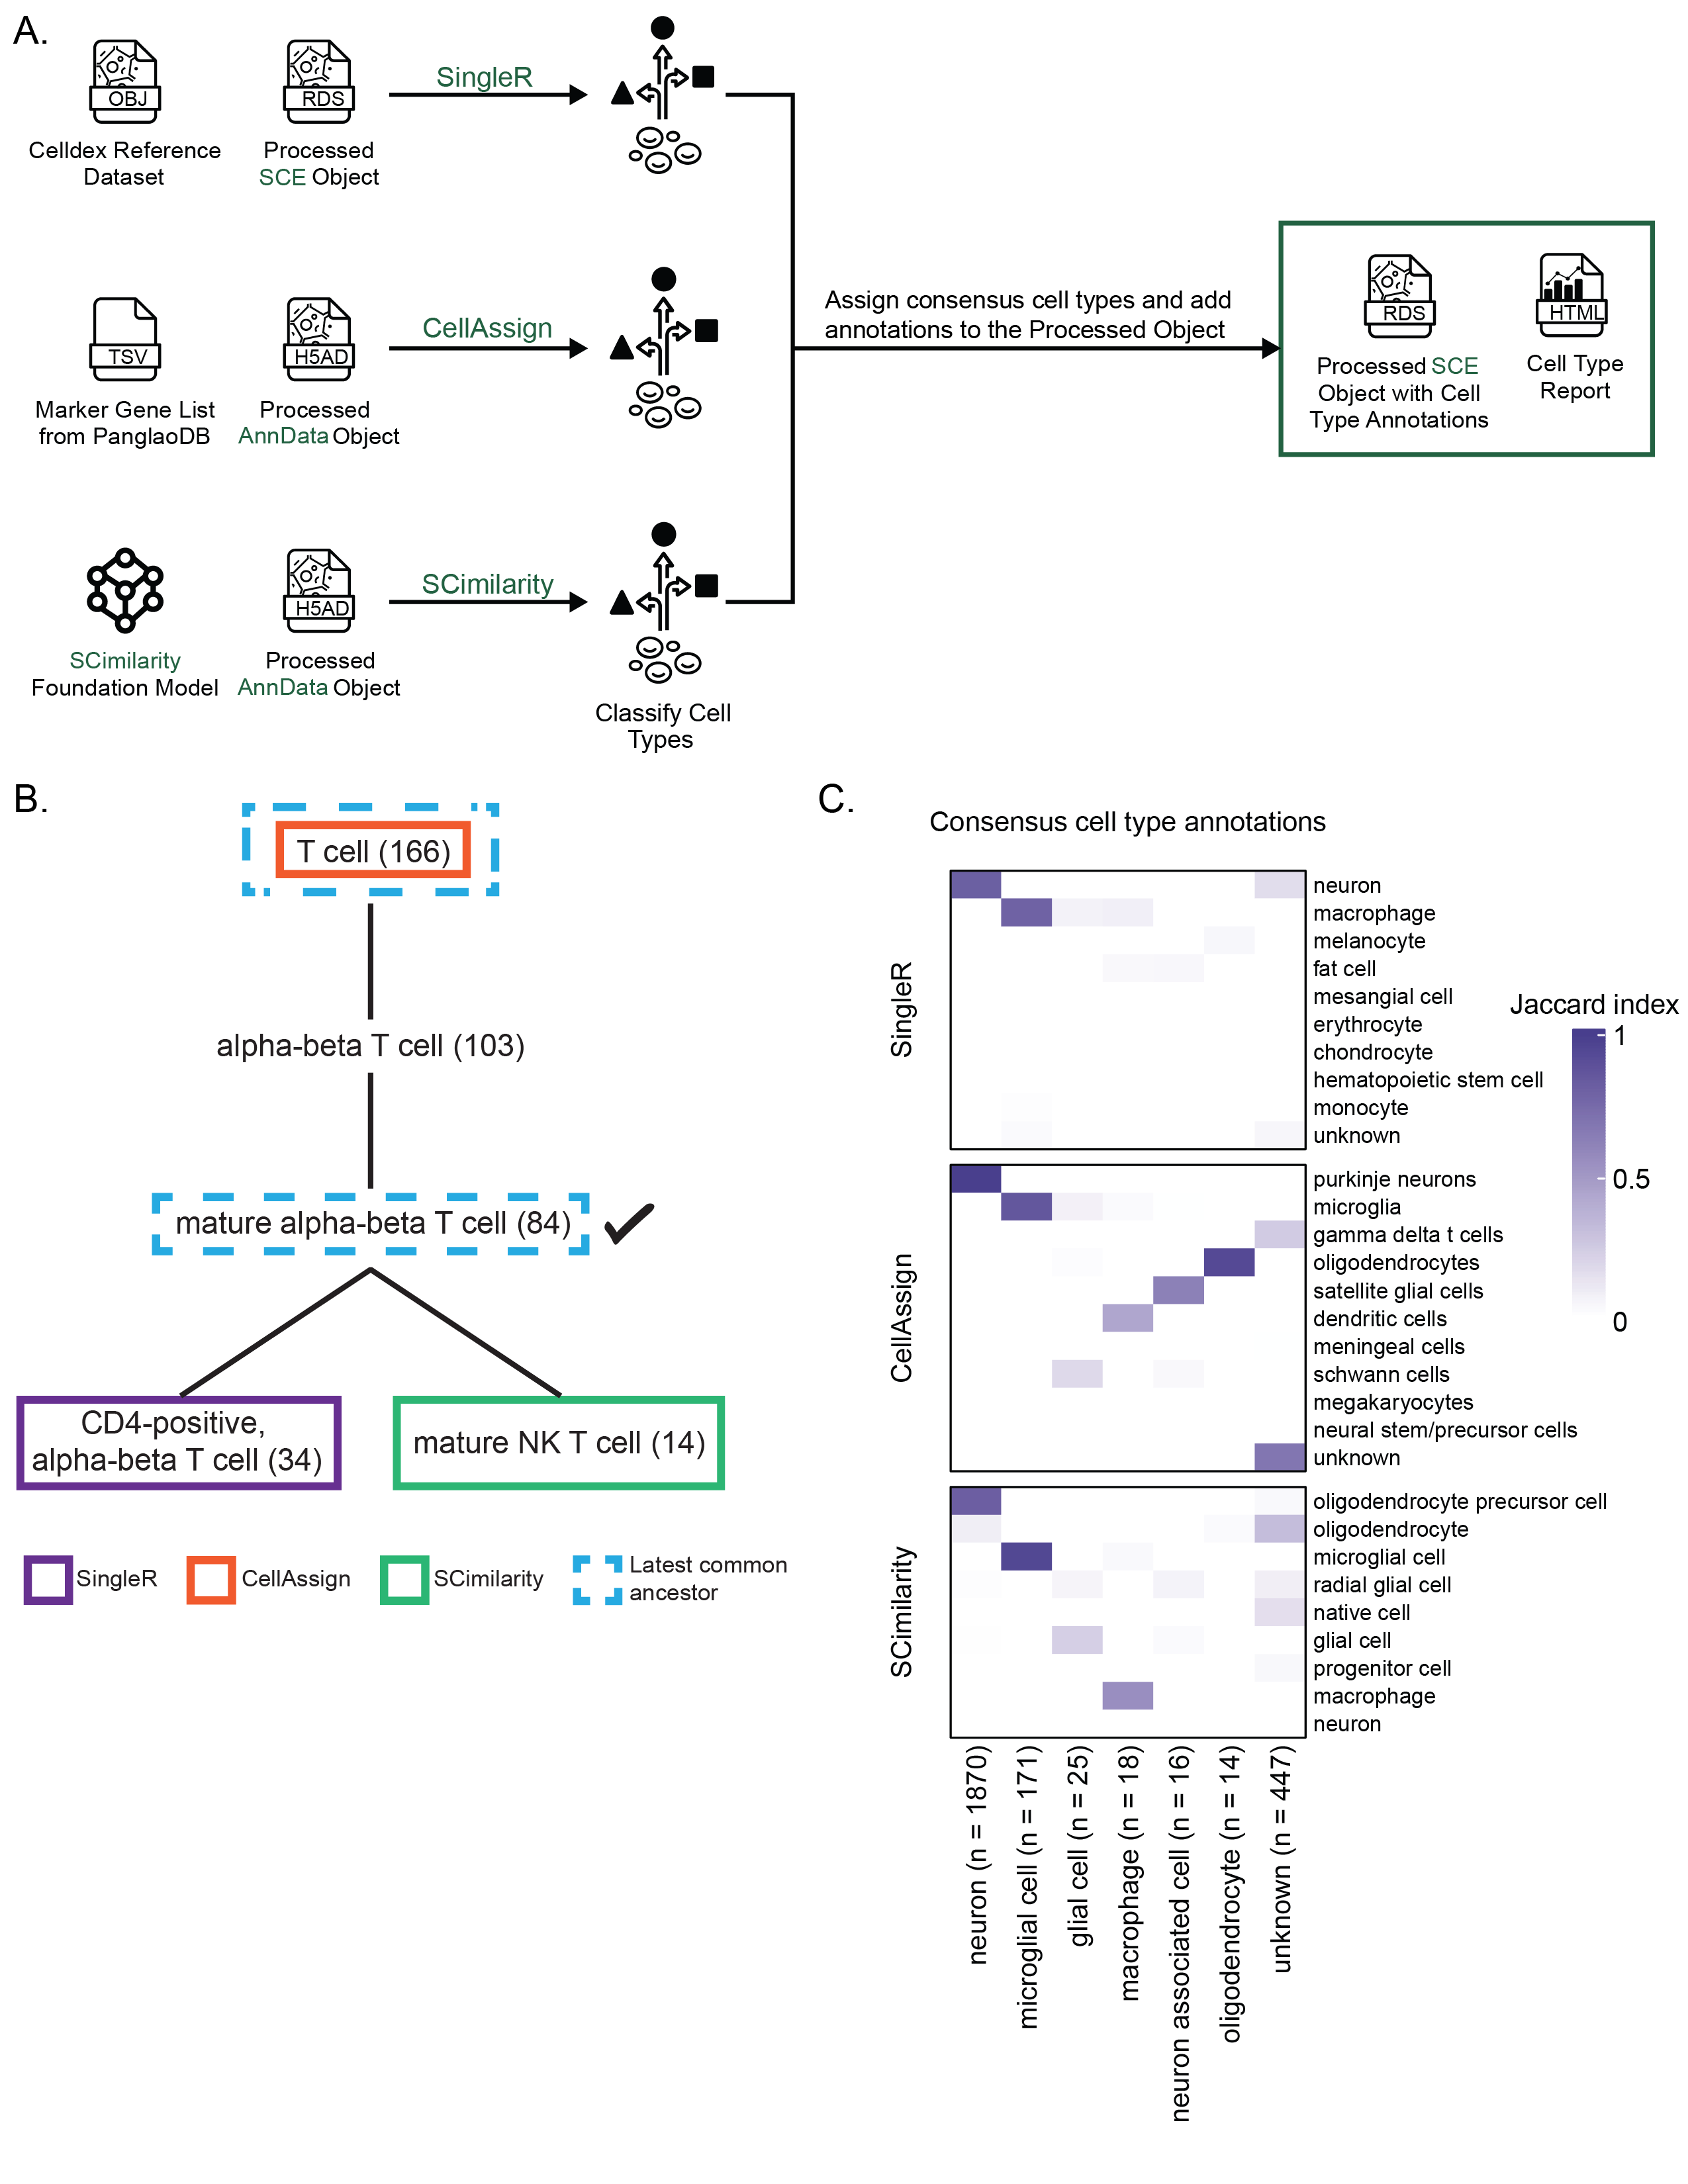
As such, we include cell type annotations determined using three different automated methods, SingleR[49], CellAssign[50], and SCimilarity[51], in all processed SingleCellExperiment and AnnData objects (Figure 3A) (see Methods for more details about how each method is implemented).
An additional cell type report with information about reference sources, comparisons among cell type annotation methods, and diagnostic plots is also provided.
For some ScPCA projects, submitters provided their own curated cell type annotations, including annotation of tumor cells and disease-specific cell states.
These submitter-provided annotations can be found in all SingleCellExperiment and AnnData objects (unfiltered, filtered, and processed).
Cell type reports for these projects include a table summarizing the submitter cell type annotations, a UMAP plot colored by the submitter annotation, and a comparison of the submitter annotations to the automated cell typing results.
Assigning consensus cell types
SingleR, CellAssign, and SCimilarity use different references and distinct computational approaches to label cells.
Additionally, most public annotated reference datasets compatible with SingleR and CellAssign – including those we use for the Portal – are derived from normal tissue, making accurately annotating tumor datasets particularly difficult.
Consistent cell type annotations across methods can indicate higher confidence in the provided labels, so we created a set of ontology-aware rules to assign consensus cell type labels based on the methods’ agreement.
scpca-nf assigns consensus cell type labels when two of the three automated methods agree.
Specifically, we perform pairwise comparisons among cell type annotations assigned by each method and identify the cell types’ latest common ancestor (LCA) in Cell Ontology [59,60,61].
The consensus cell type is the LCA term with the fewest descendants (Figure 3B).
To ensure specificity in the consensus labels, cells are only assigned a consensus cell type if the identified LCA has no more than 170 descendant terms, with a few exceptions as described in Methods.
We chose this threshold to exclude overly general cell ontology terms, such as lymphocyte, while retaining meaningful classifications like T cell and B cell.
Consensus cell type assignments are available in all processed SingleCellExperiment and AnnData objects on the Portal.
The resulting consensus cell type labels provide harmonized cell type annotations for all samples in the ScPCA Portal, facilitating downstream analyses across multiple samples.
Figure 3C shows an example heatmap colored by Jaccard index between the top consensus cell types and cell type labels from each automated method.
Jaccard index values close to 1 indicate strong agreement and a high proportion of overlapping cells, which may indicate higher confidence predictions.
Importantly, using an ontology-based approach allowed us to account for different levels of granularity in annotation reference datasets.
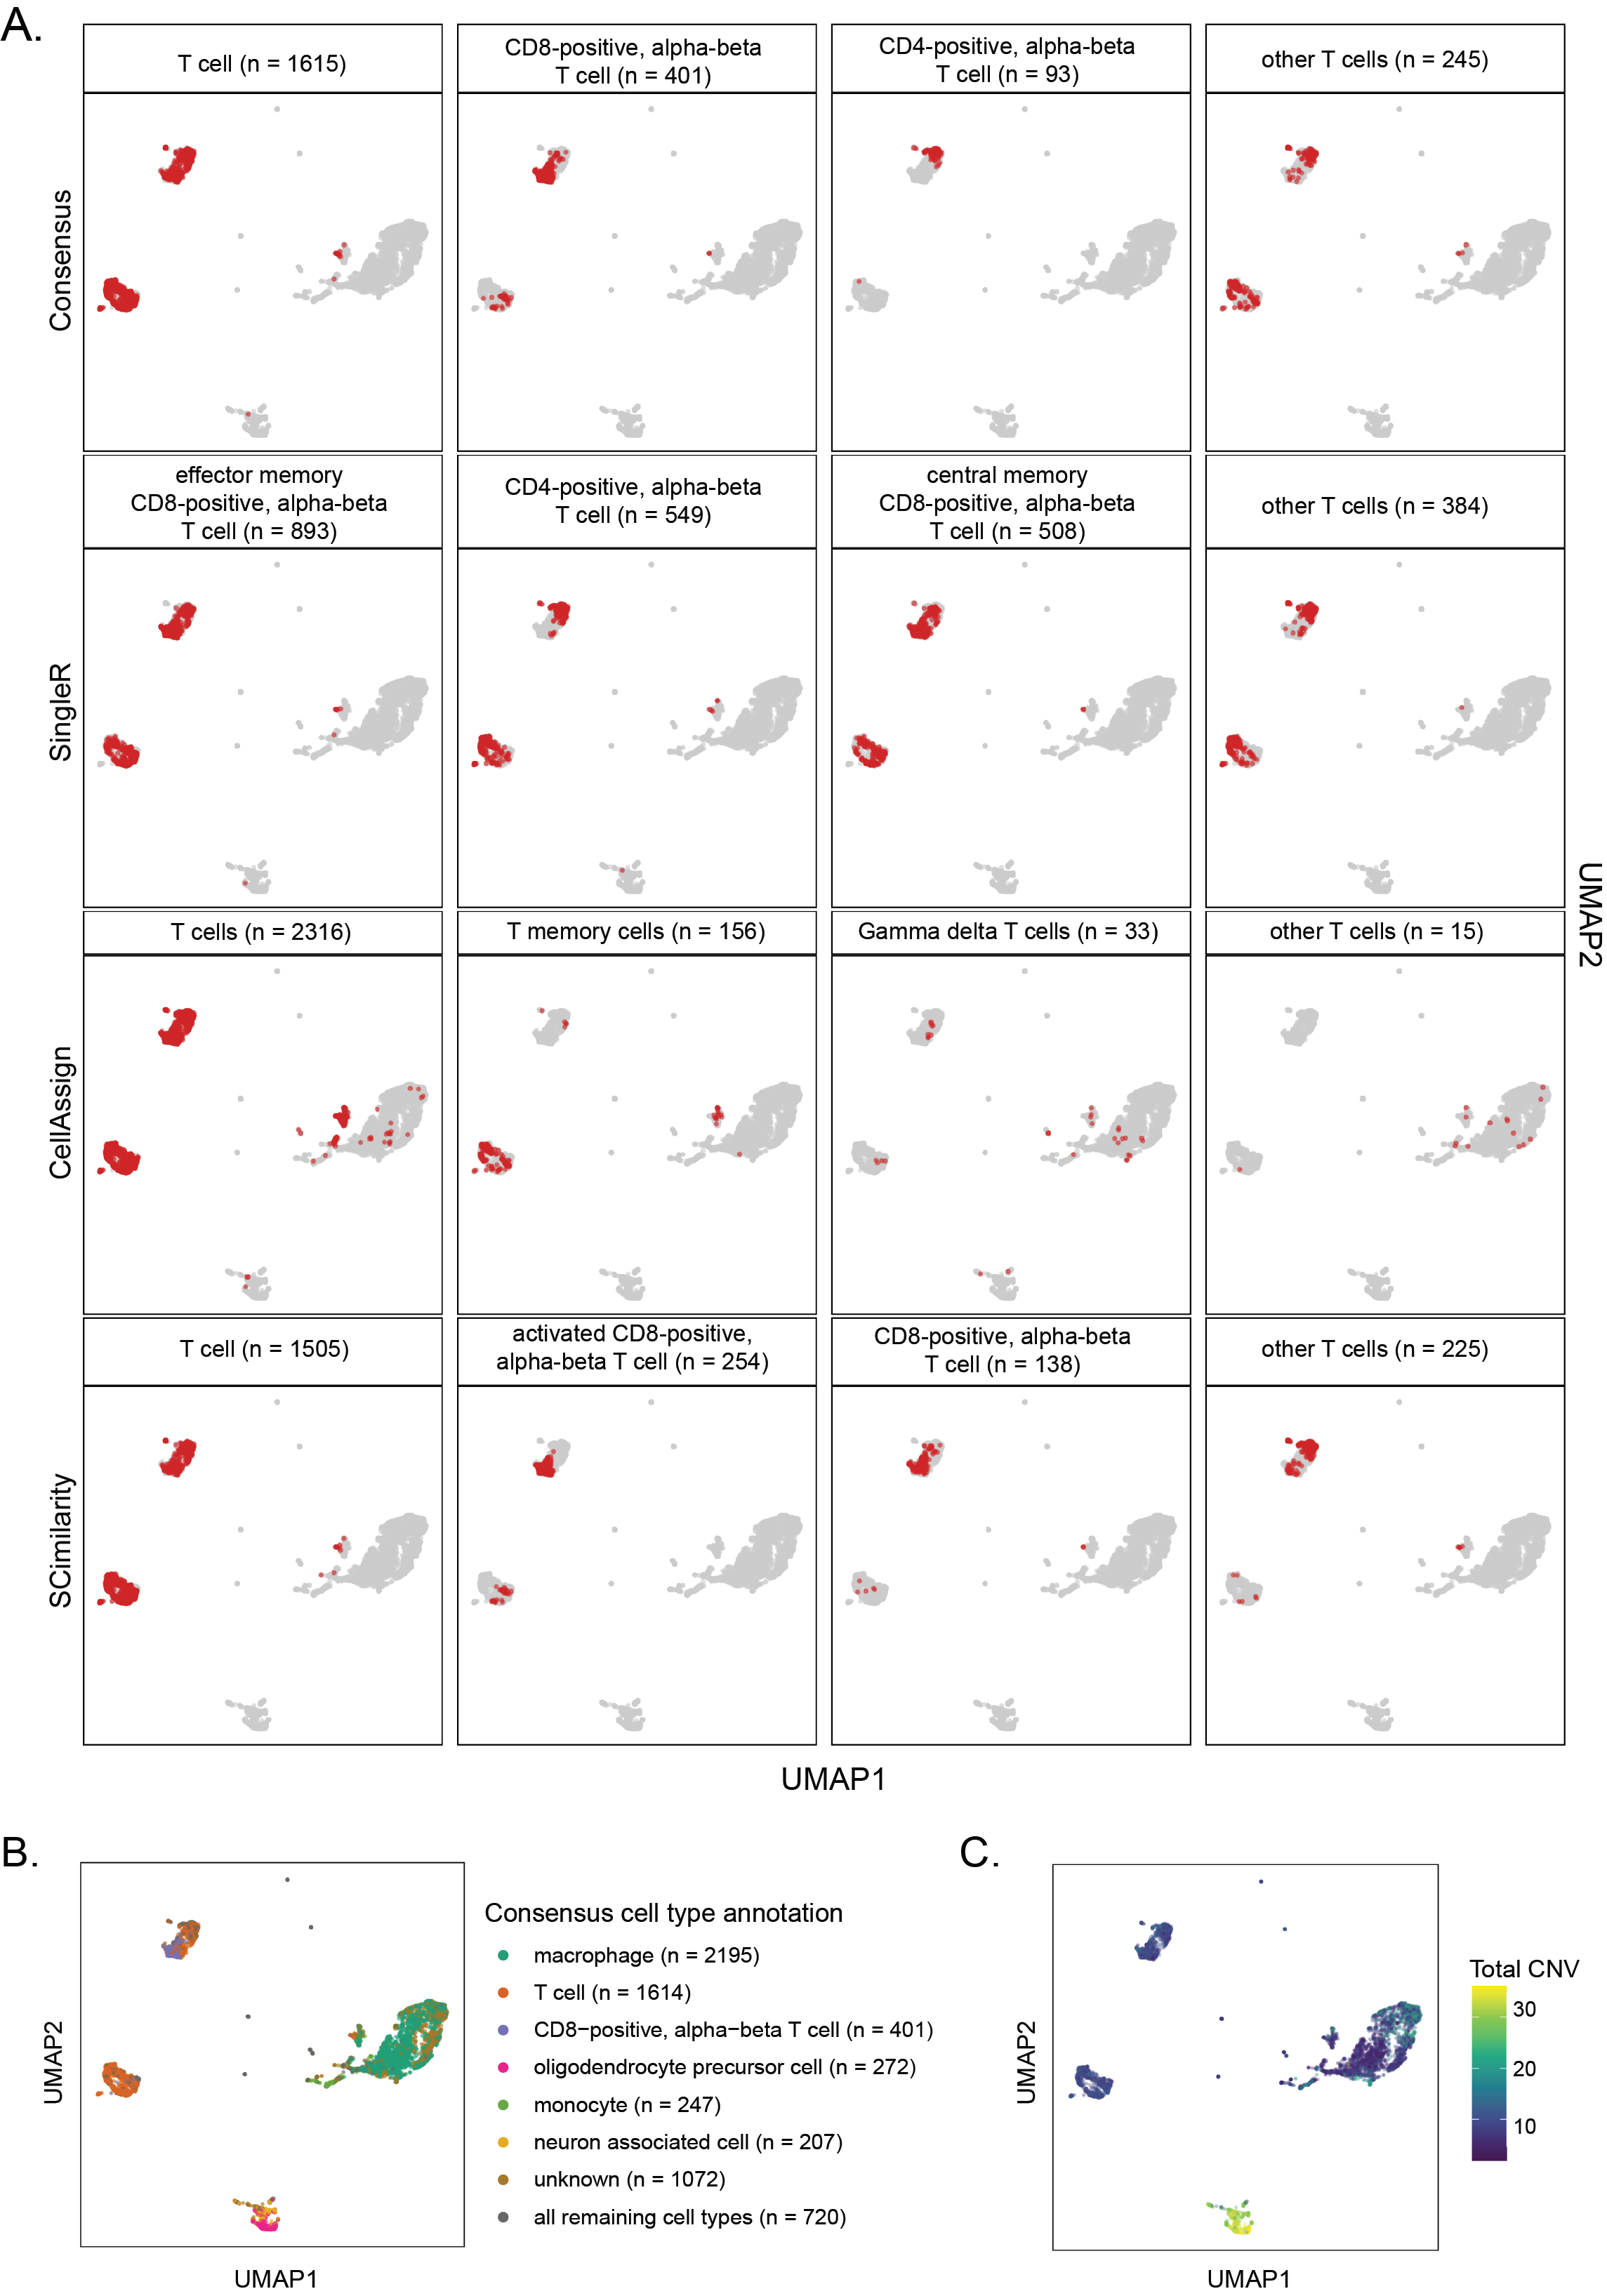
An example is shown in Figure S4A, which displays cells that are annotated as different T cell subtypes by each automated method.
Harmonizing annotations across all methods by assigning a consensus cell type provides a single, consistent label for each cell (Figure S4B).
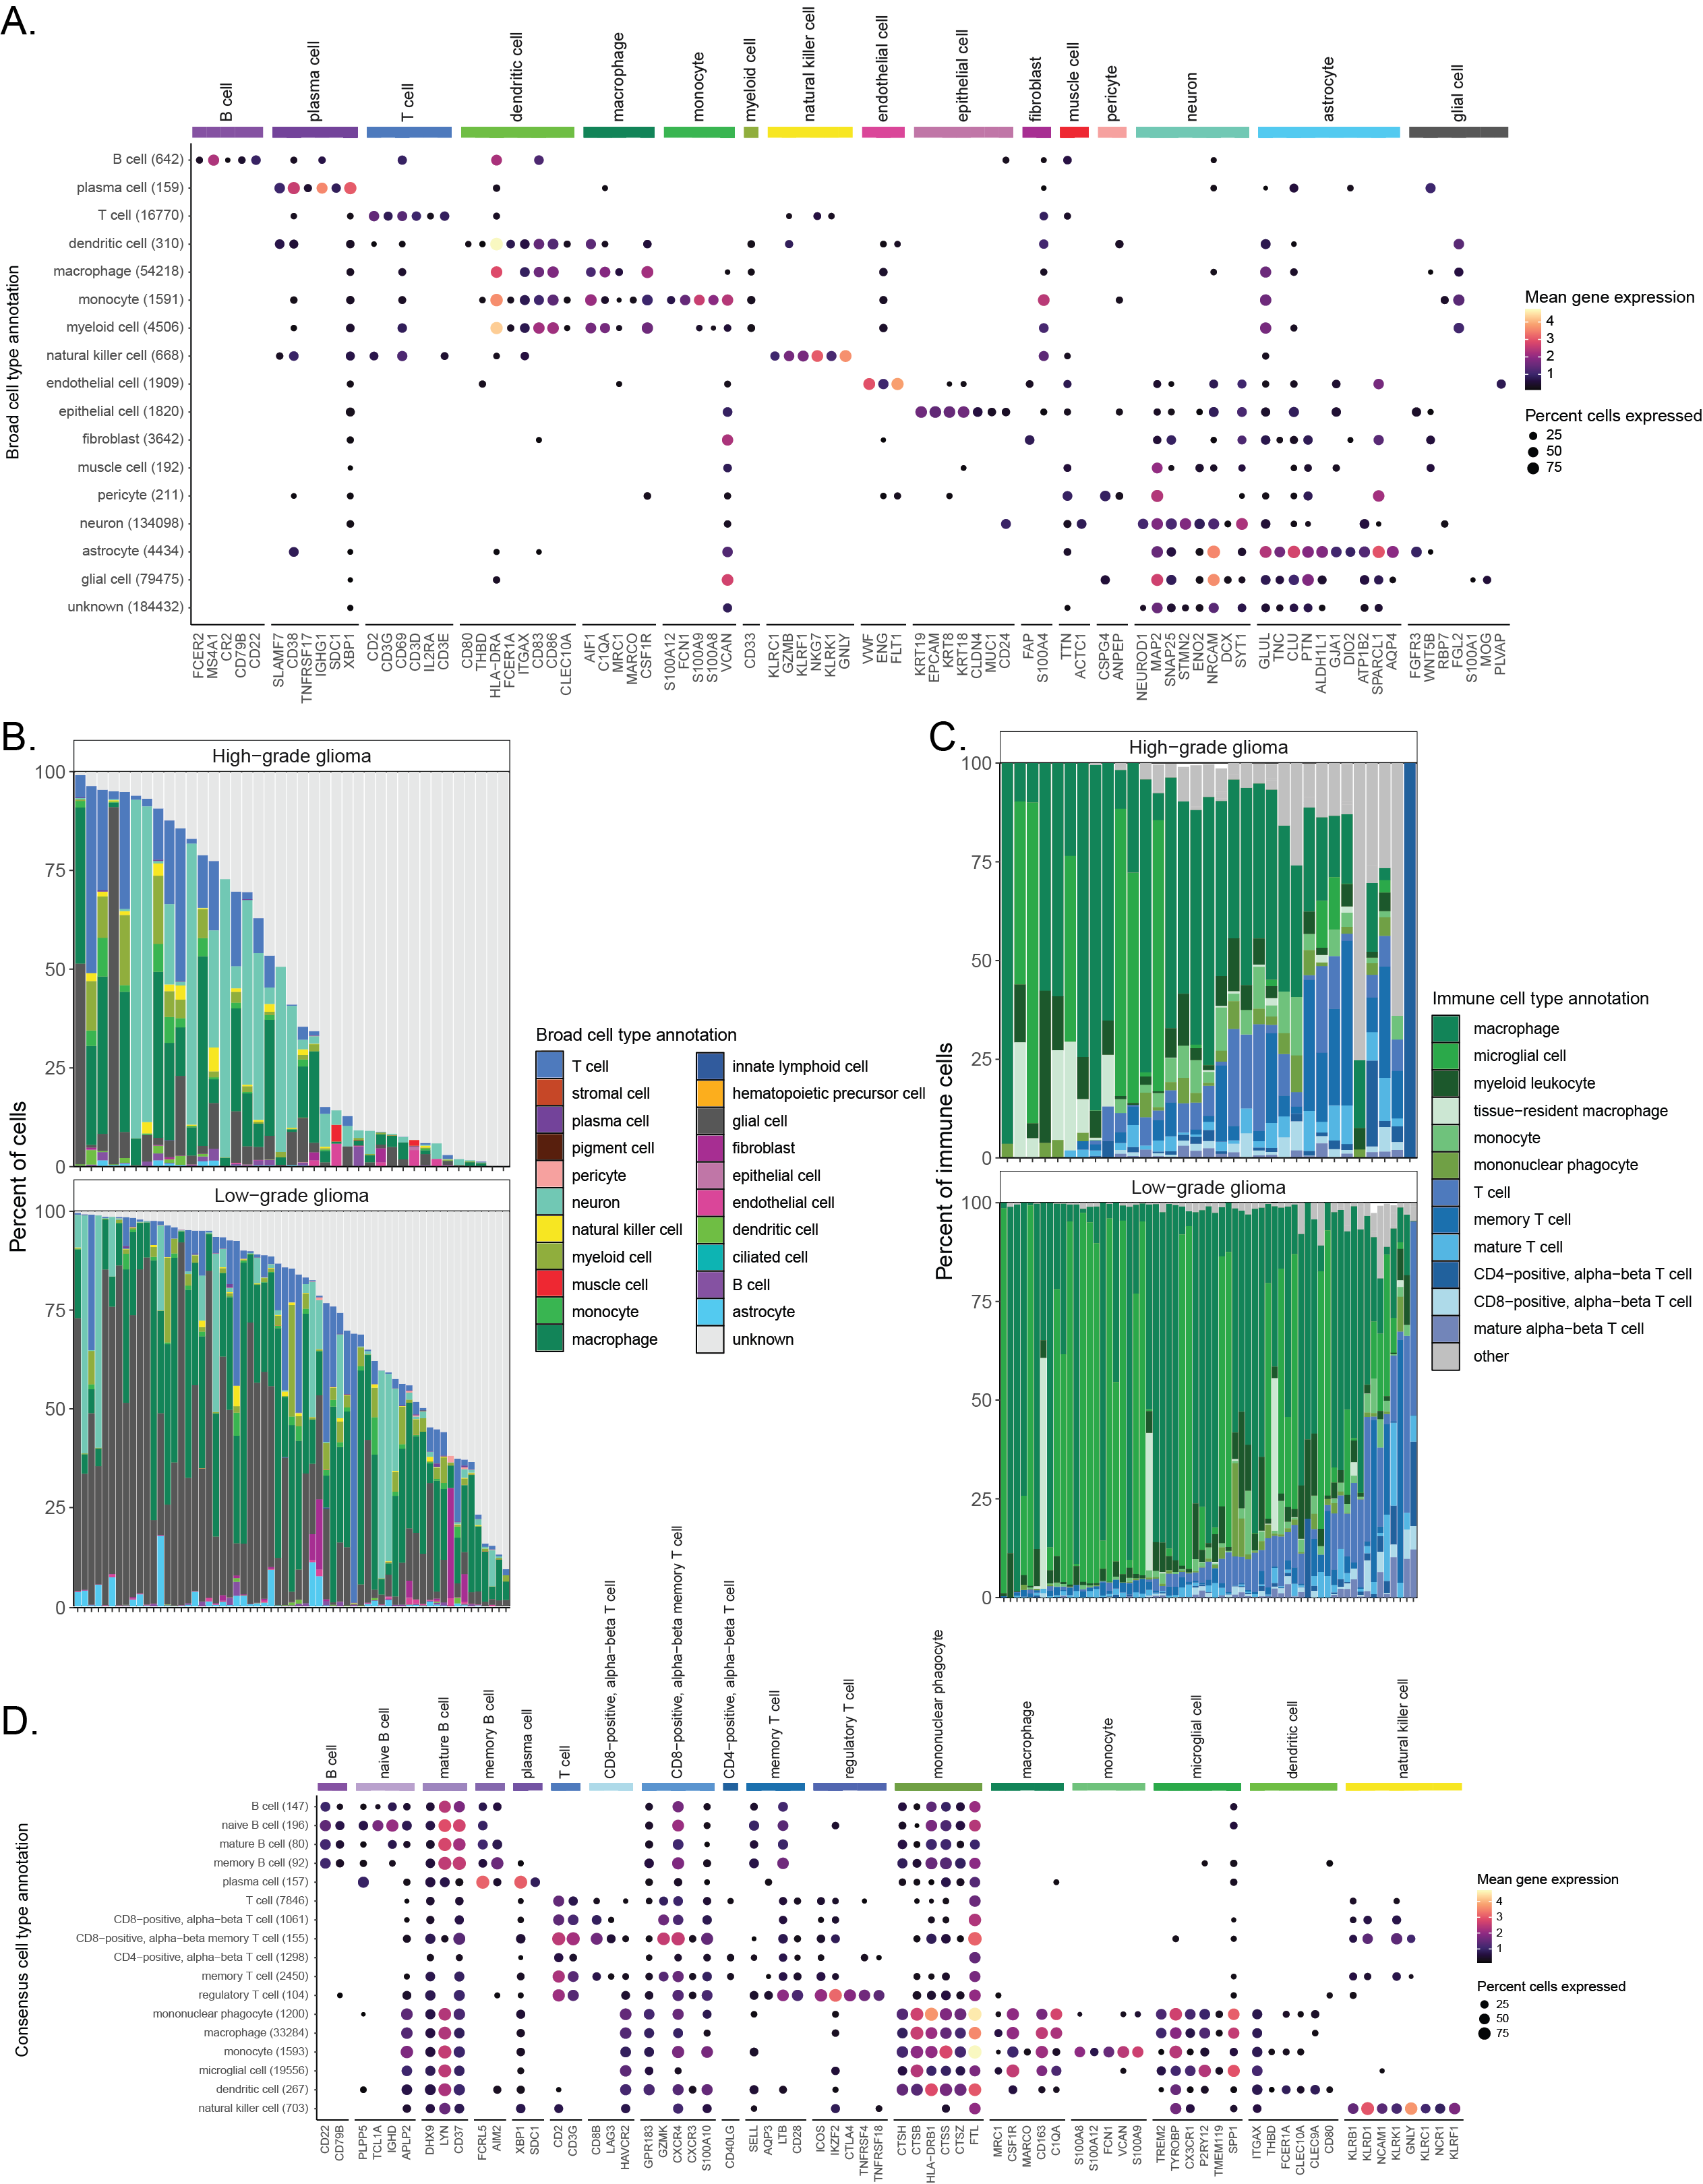
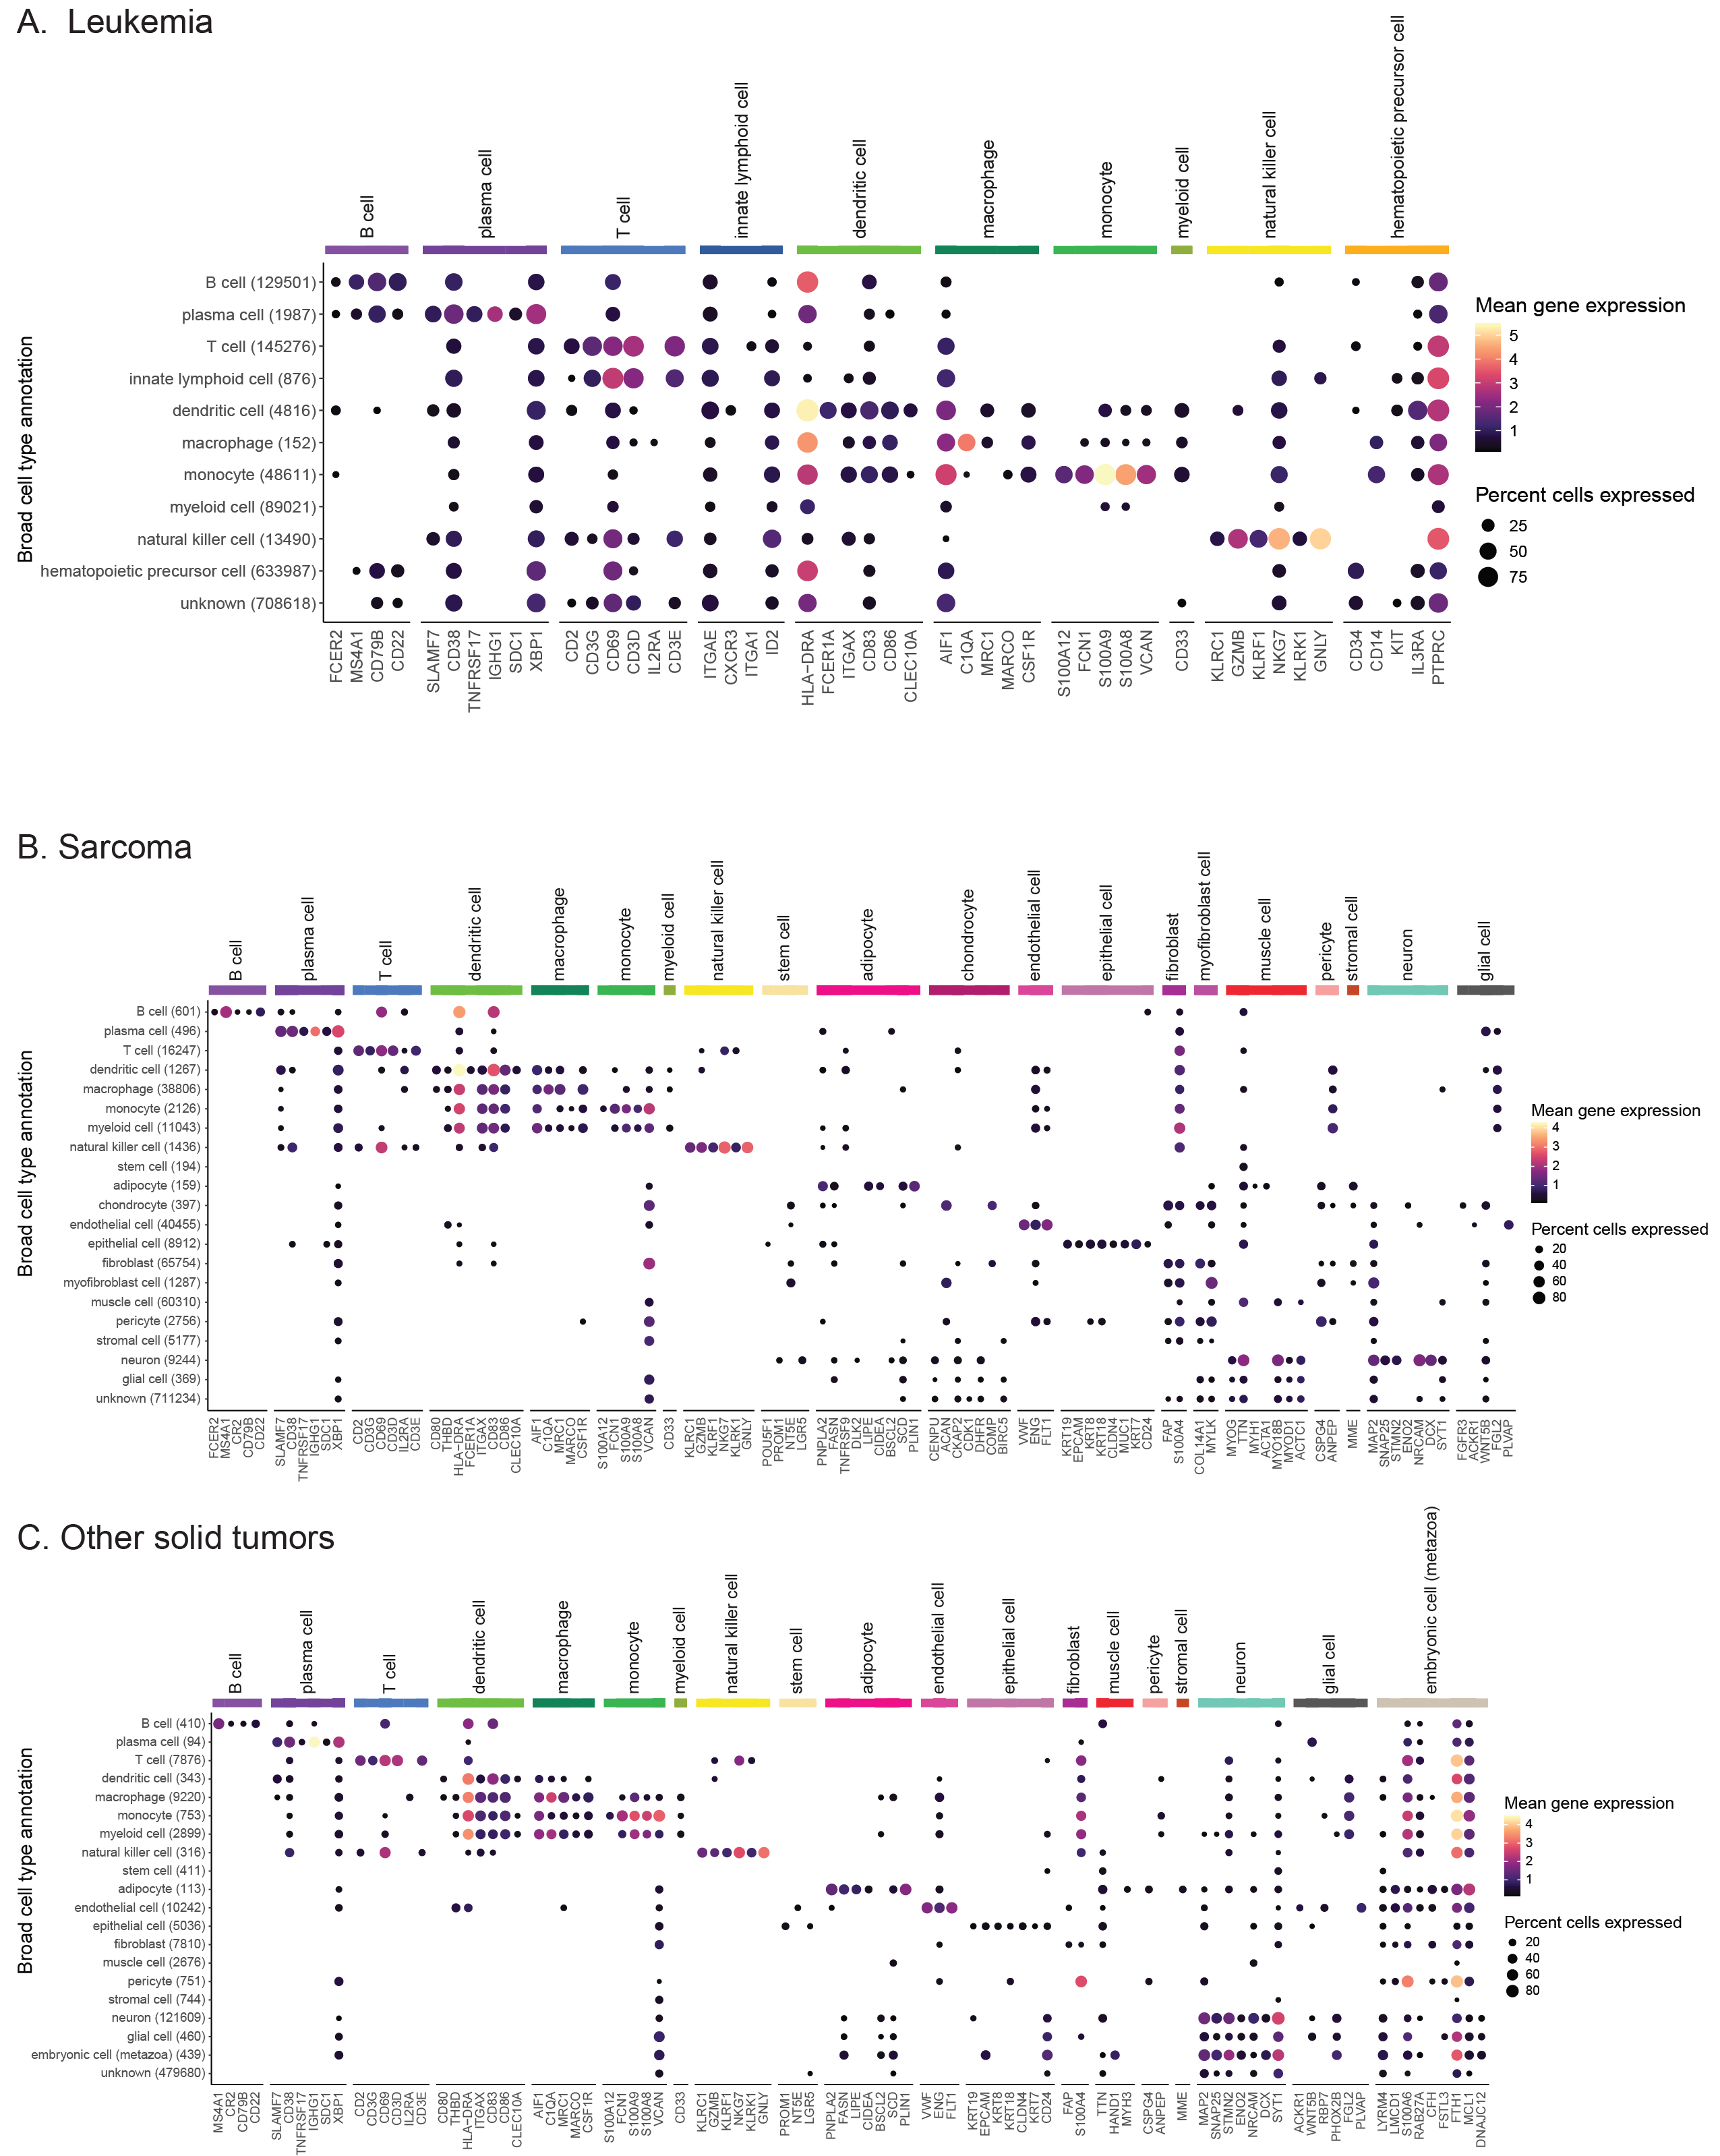
We validated consensus cell types by evaluating cell-type-specific marker gene expression across all cells (Figure 4A, Figure S5), observing high concordance between consensus cell type labels and expected marker gene expression.
Note that a library-specific version of these marker gene expression dot plots is provided in the summary QC report.
In addition, an expanded version of the heatmap shown in Figure 3C with all consensus cell types is provided in the summary cell type report.
These visualizations allow users to assess the reliability of consensus annotations and clearly see how cell type labels from different automated methods contribute to the final consensus label.
Consensus cell type annotations in brain and CNS samples available on the Portal
Consensus annotations can be particularly useful when examining samples from multiple projects submitted by different investigators.
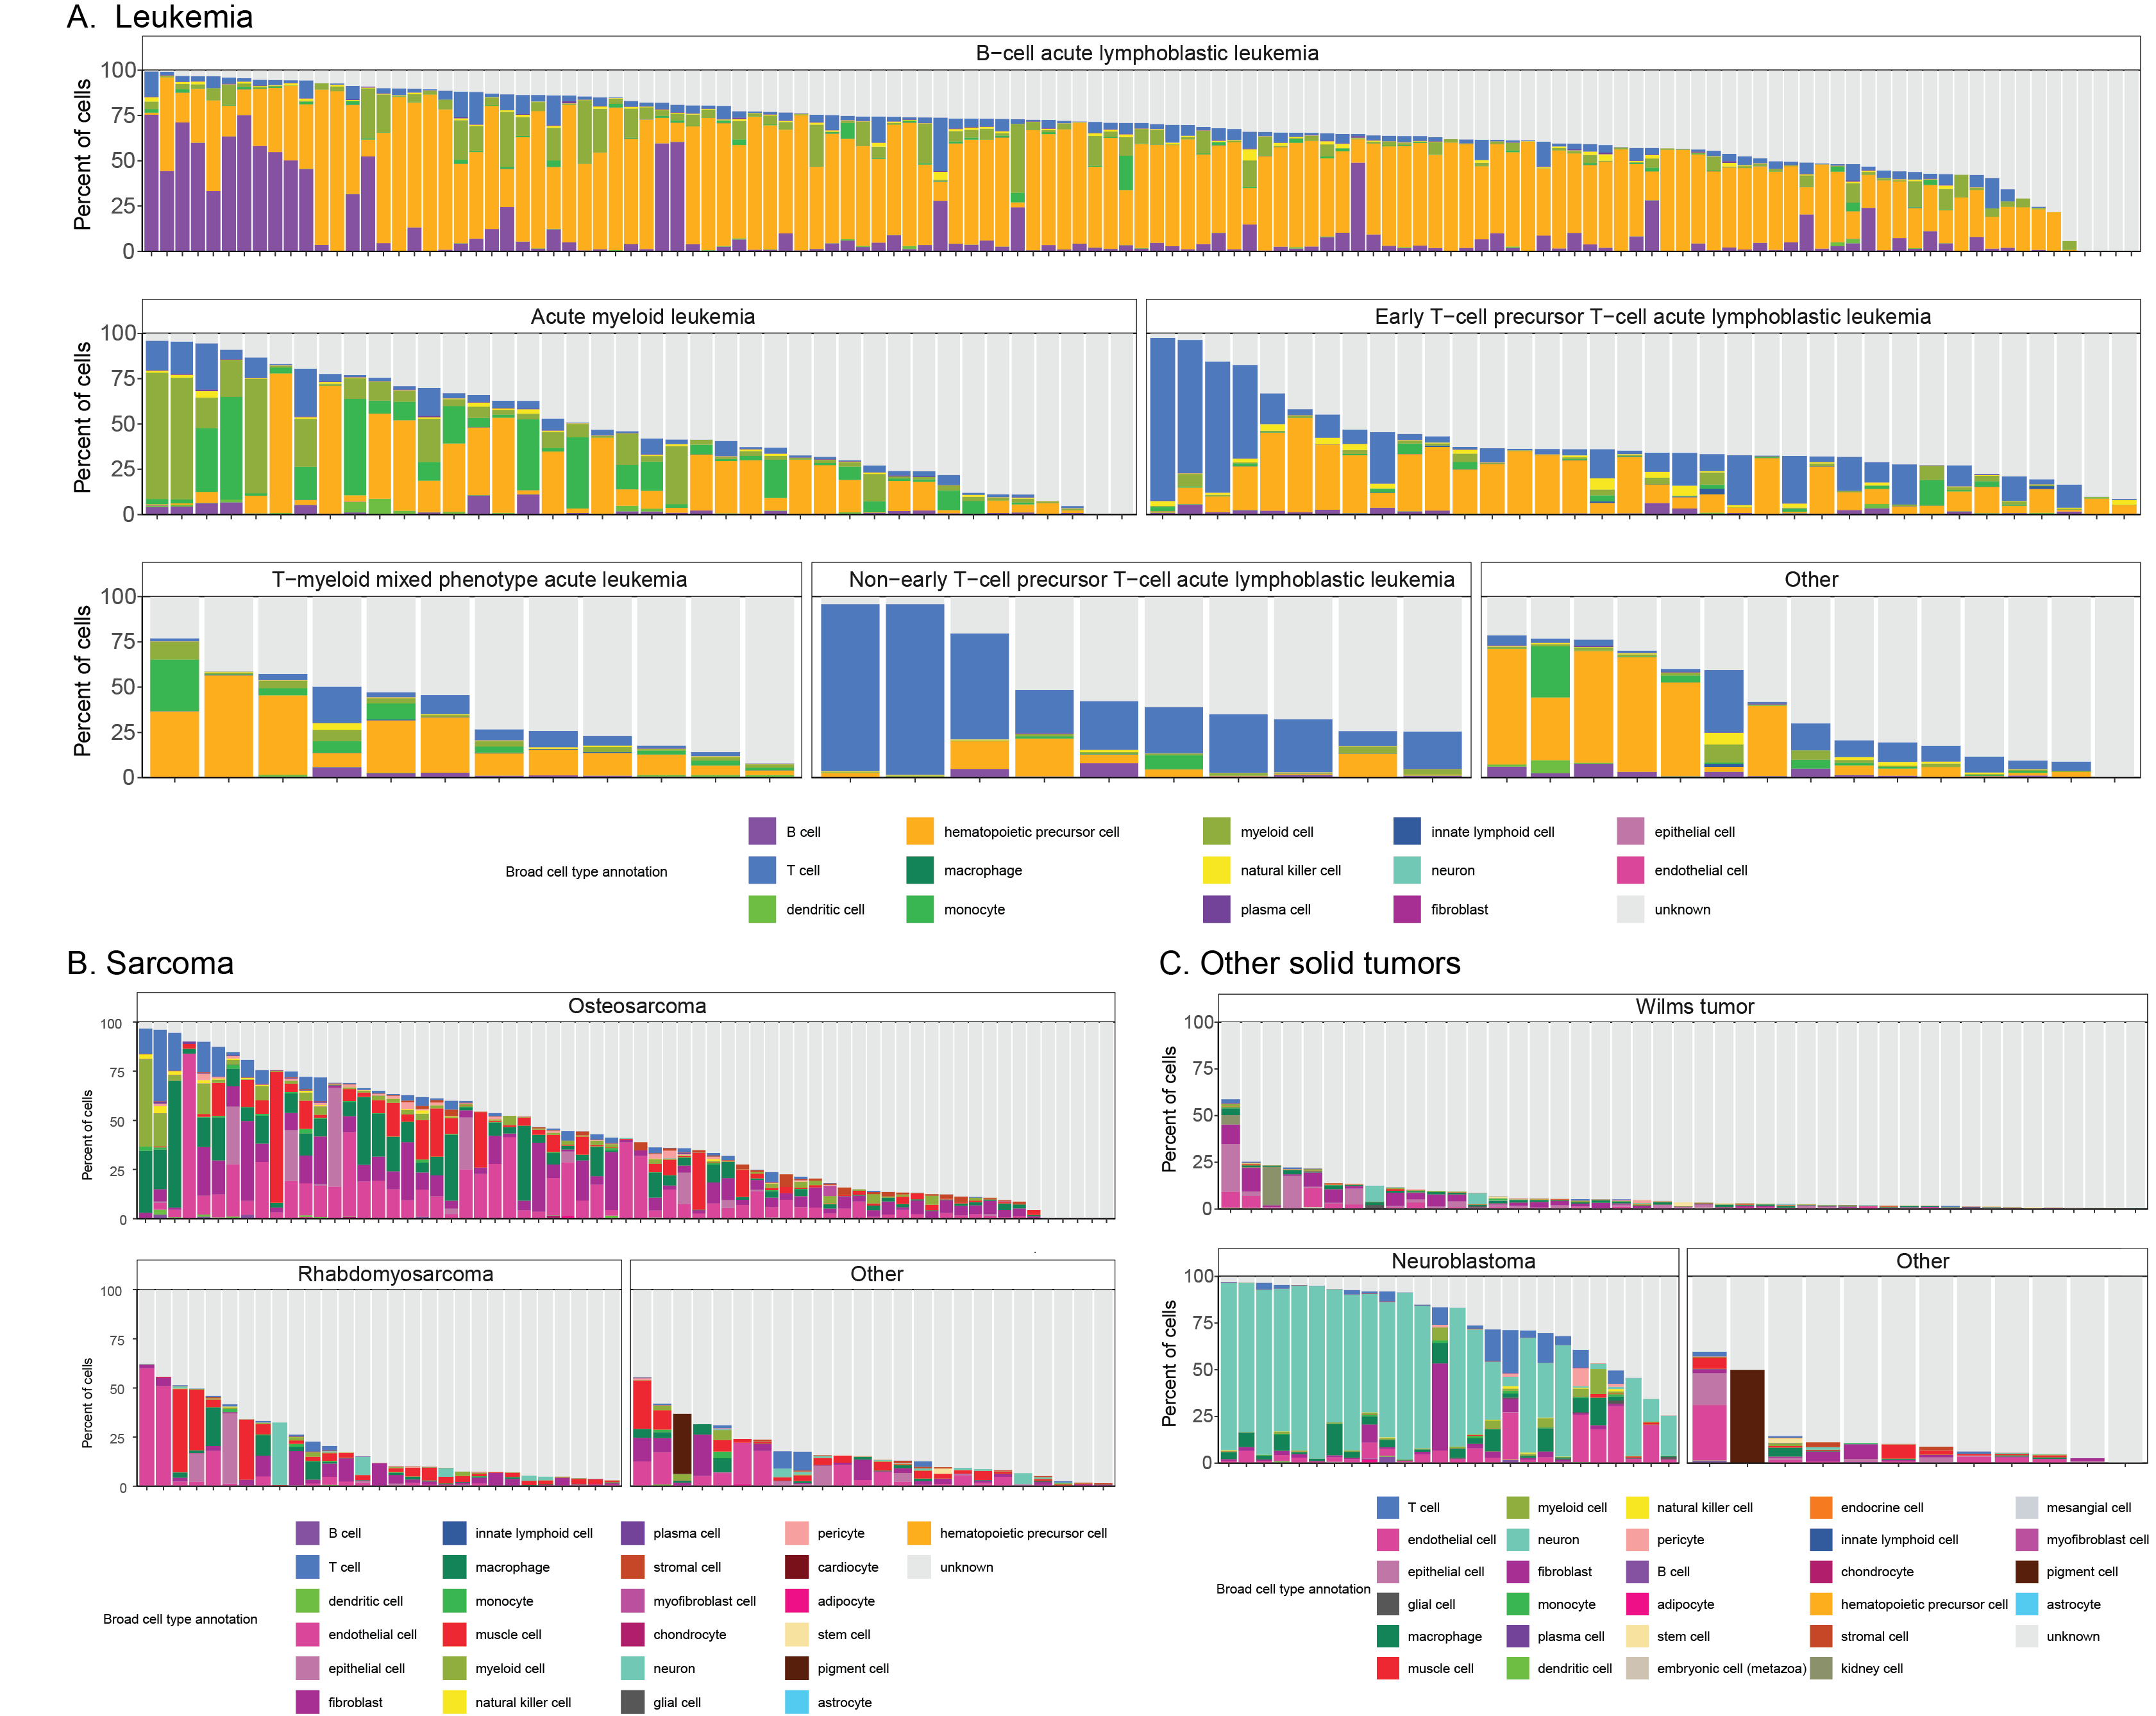
For example, we show the distribution of cell types observed in all high-grade (HGG) and low-grade glioma (LGG) samples in Figure 4B, which originate from six different projects and four different investigators.
Here, we can identify similar cell types across all glioma samples, but the composition of cell types present in each sample is heterogeneous.
Previous studies have characterized the glioma immune microenvironment as being predominantly composed of myeloid cells, including microglia and glioma-associated macrophages, with smaller proportions of lymphocytes such as T cells [62,63].
Focusing on the immune infiltrate in glioma samples reveals that most immune cells in ScPCA samples are classified as either myeloid or T cell types.
However, there is notable heterogeneity even within HGG and LGG subtypes (Figure 4C).
Figure 4D shows the expression of cell-type specific markers for more granular immune cell types, validating the assignment of various immune cell types within the assigned consensus cell types.
A summary of all the consensus cell types observed in all other ScPCA samples can be found in Figure S6.
Augmenting cell type annotations for malignant cell identification
Because the consensus annotations are derived from automated methods that do not specifically consider tumor cell states, they provide limited information for distinguishing malignant from normal cells.
We therefore sought complementary avenues to increase the value of cell type annotations with information that can be leveraged for this purpose.
In parallel to developing the ScPCA Portal, we launched the OpenScPCA project [64], an open-science collaborative initiative to further characterize and analyze Portal data, focusing first on improving cell type annotations within specific cancer types.
Thus far, we have added cell type annotations for two projects, SCPCP000004 (neuroblastoma) and SCPCP000015 (Ewing sarcoma), to the Portal based on OpenScPCA analyses.
Figure 5A displays, for example, a UMAP of all libraries in SCPCP000004 highlighting this project’s OpenScPCA annotations, which were derived using the NBAtlas dataset as a reference [65].
Unlike the consensus cell type annotations, the OpenScPCA annotations distinguish between normal and malignant cells and contain far fewer uncharacterized cells.
For example, for SCPCP000004, the consensus cell type procedure labeled ~80% of cells, but the OpenScPCA project labeled ~88% of cells.
When OpenScPCA annotations are available, the Portal’s summary cell type report also includes comparisons between the scpca-nf and OpenScPCA annotations.
In an effort to identify potential malignant cells across all samples in the Portal, scpca-nf applies InferCNV[52] to estimate copy-number alterations (Figure 2A) when enough normal cells are present in a library to serve as a reference (see Methods for details).
The CNV estimates complement the consensus cell types by providing a proxy for a cell’s malignant status; cells with high levels of CNV are more likely to be tumor cells.
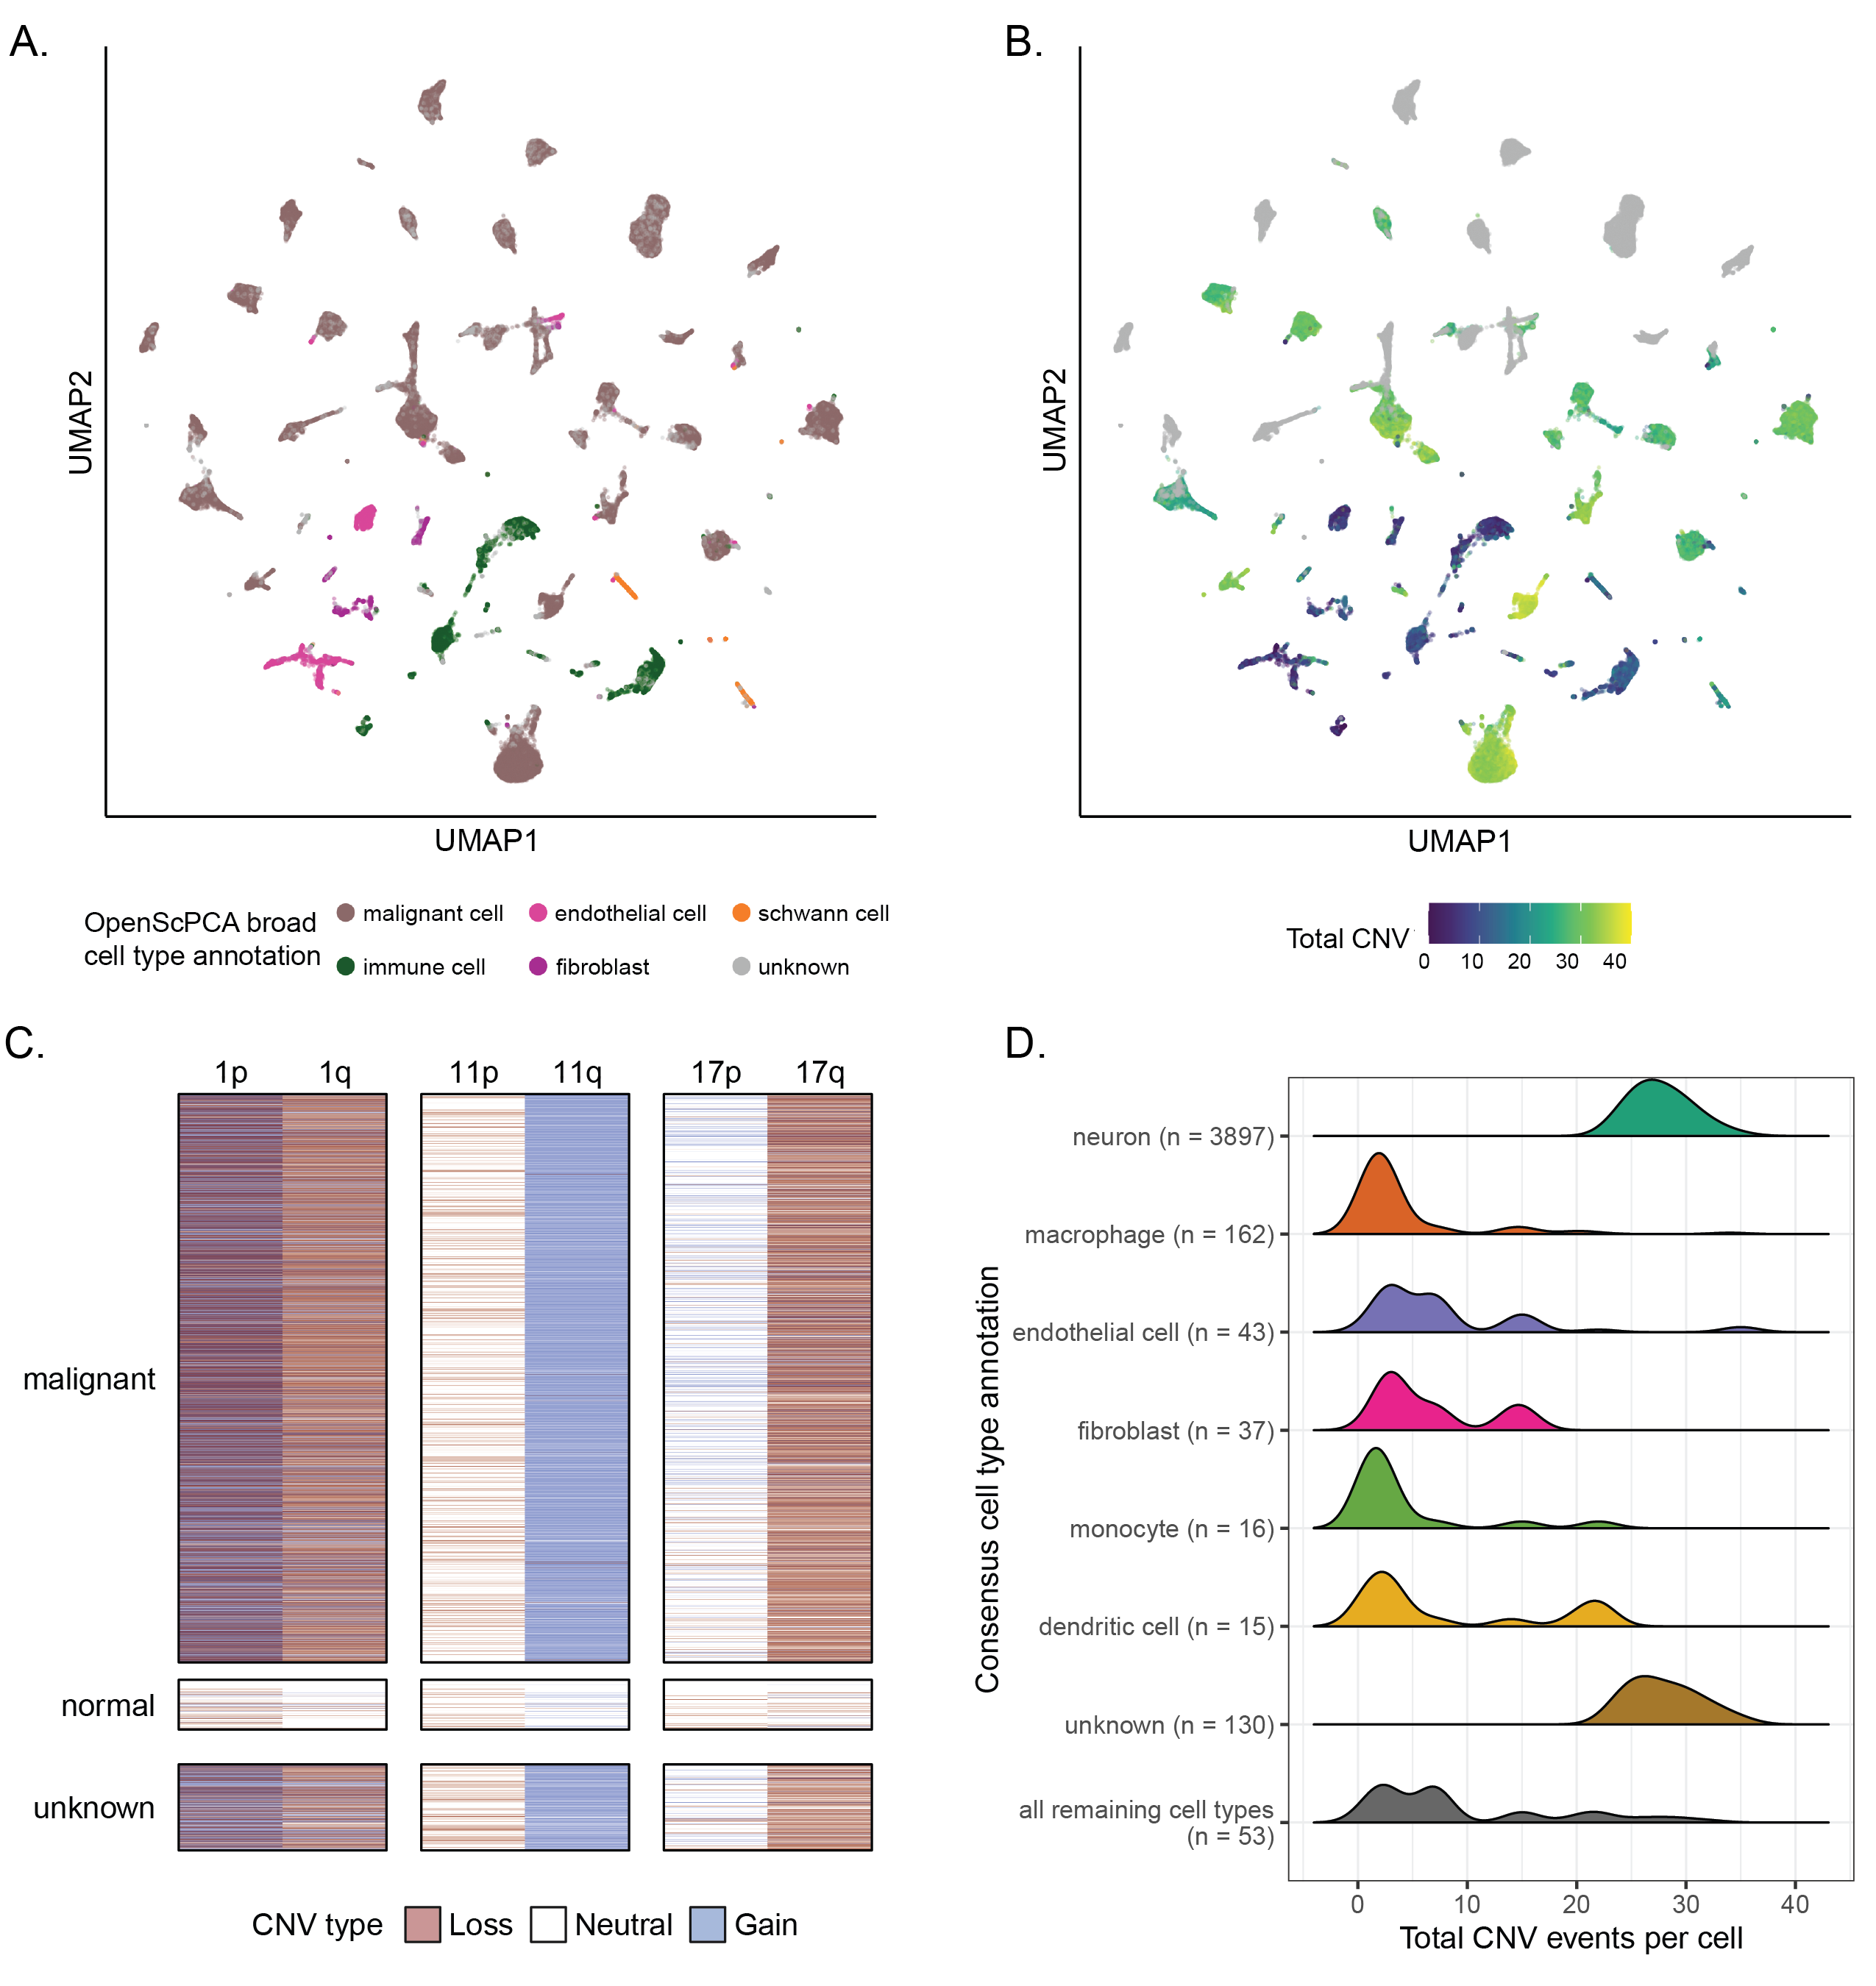
Across libraries within SCPCP000004, we observe broad correspondence between malignant cell type annotations from OpenScPCA (which does not use CNV information) (Figure 5A) and the total per-cell CNV (Figure 5B).
We probed this relationship further within a single neuroblastoma library, SCPCL000130, finding clear signatures of canonical neuroblastoma CNV events such as 1q loss, 11q gain, and 17p loss [65,66,67] within malignant cells (Figure 5C).
By contrast, normal cells show very few CNV events, consistent with their annotations.
Unknown cells show CNV event signatures more similar to the malignant cells than to the normal cells, suggesting many of these cells may indeed be malignant.
We also see traces of this relationship even when looking at the consensus cell types in conjunction with CNV events.
Figure 5D shows the distributions of per-cell total CNV events for the most commonly-observed consensus cell types in the neuroblastoma library SCPCL000130.
Here, unknown and neuron cells have distinctly higher total CNV values compared to other cell types, suggesting that they are likely malignant.
We see similar patterns for the ganglioglioma library SCPCL000049 (Figure S4B-C), where consensus immune cell types have low total CNV values, while other cell types including oligodendrocyte precursor cells, neuron associated cells, and unknown cells have much higher total CNV values.
As such, joint information from consensus cell type annotations and InferCNV results can help identify malignant cells across libraries in the Portal, including those which do not yet have associated OpenScPCA project annotations.
Analysis of bulk RNA-seq
Several projects in the ScPCA Portal contain bulk RNA-seq data in addition to single-cell or single-nuclei RNA-seq data.
Previous research has suggested that, compared to bulk RNA-seq, single-cell and single-nuclei RNA-seq technologies may fail to capture certain cell types [68] due to technical aspects of library preparation.
We therefore asked whether we could identify differences in biological signal between these two modalities that may suggest distinct cell type distributions.
We specifically focused on ScPCA projects with solid tumors, considering only samples with both sequencing modalities, excluding low-quality libraries and multiplexed samples.
We analyzed 97 samples across five projects: SCPCP00001 (high-grade glioma), SCPCP000002 (low-grade glioma), SCPCP000006 (Wilms tumor), SCPCP000009 (CNS tumors), and SCPCP000017 (osteosarcoma).
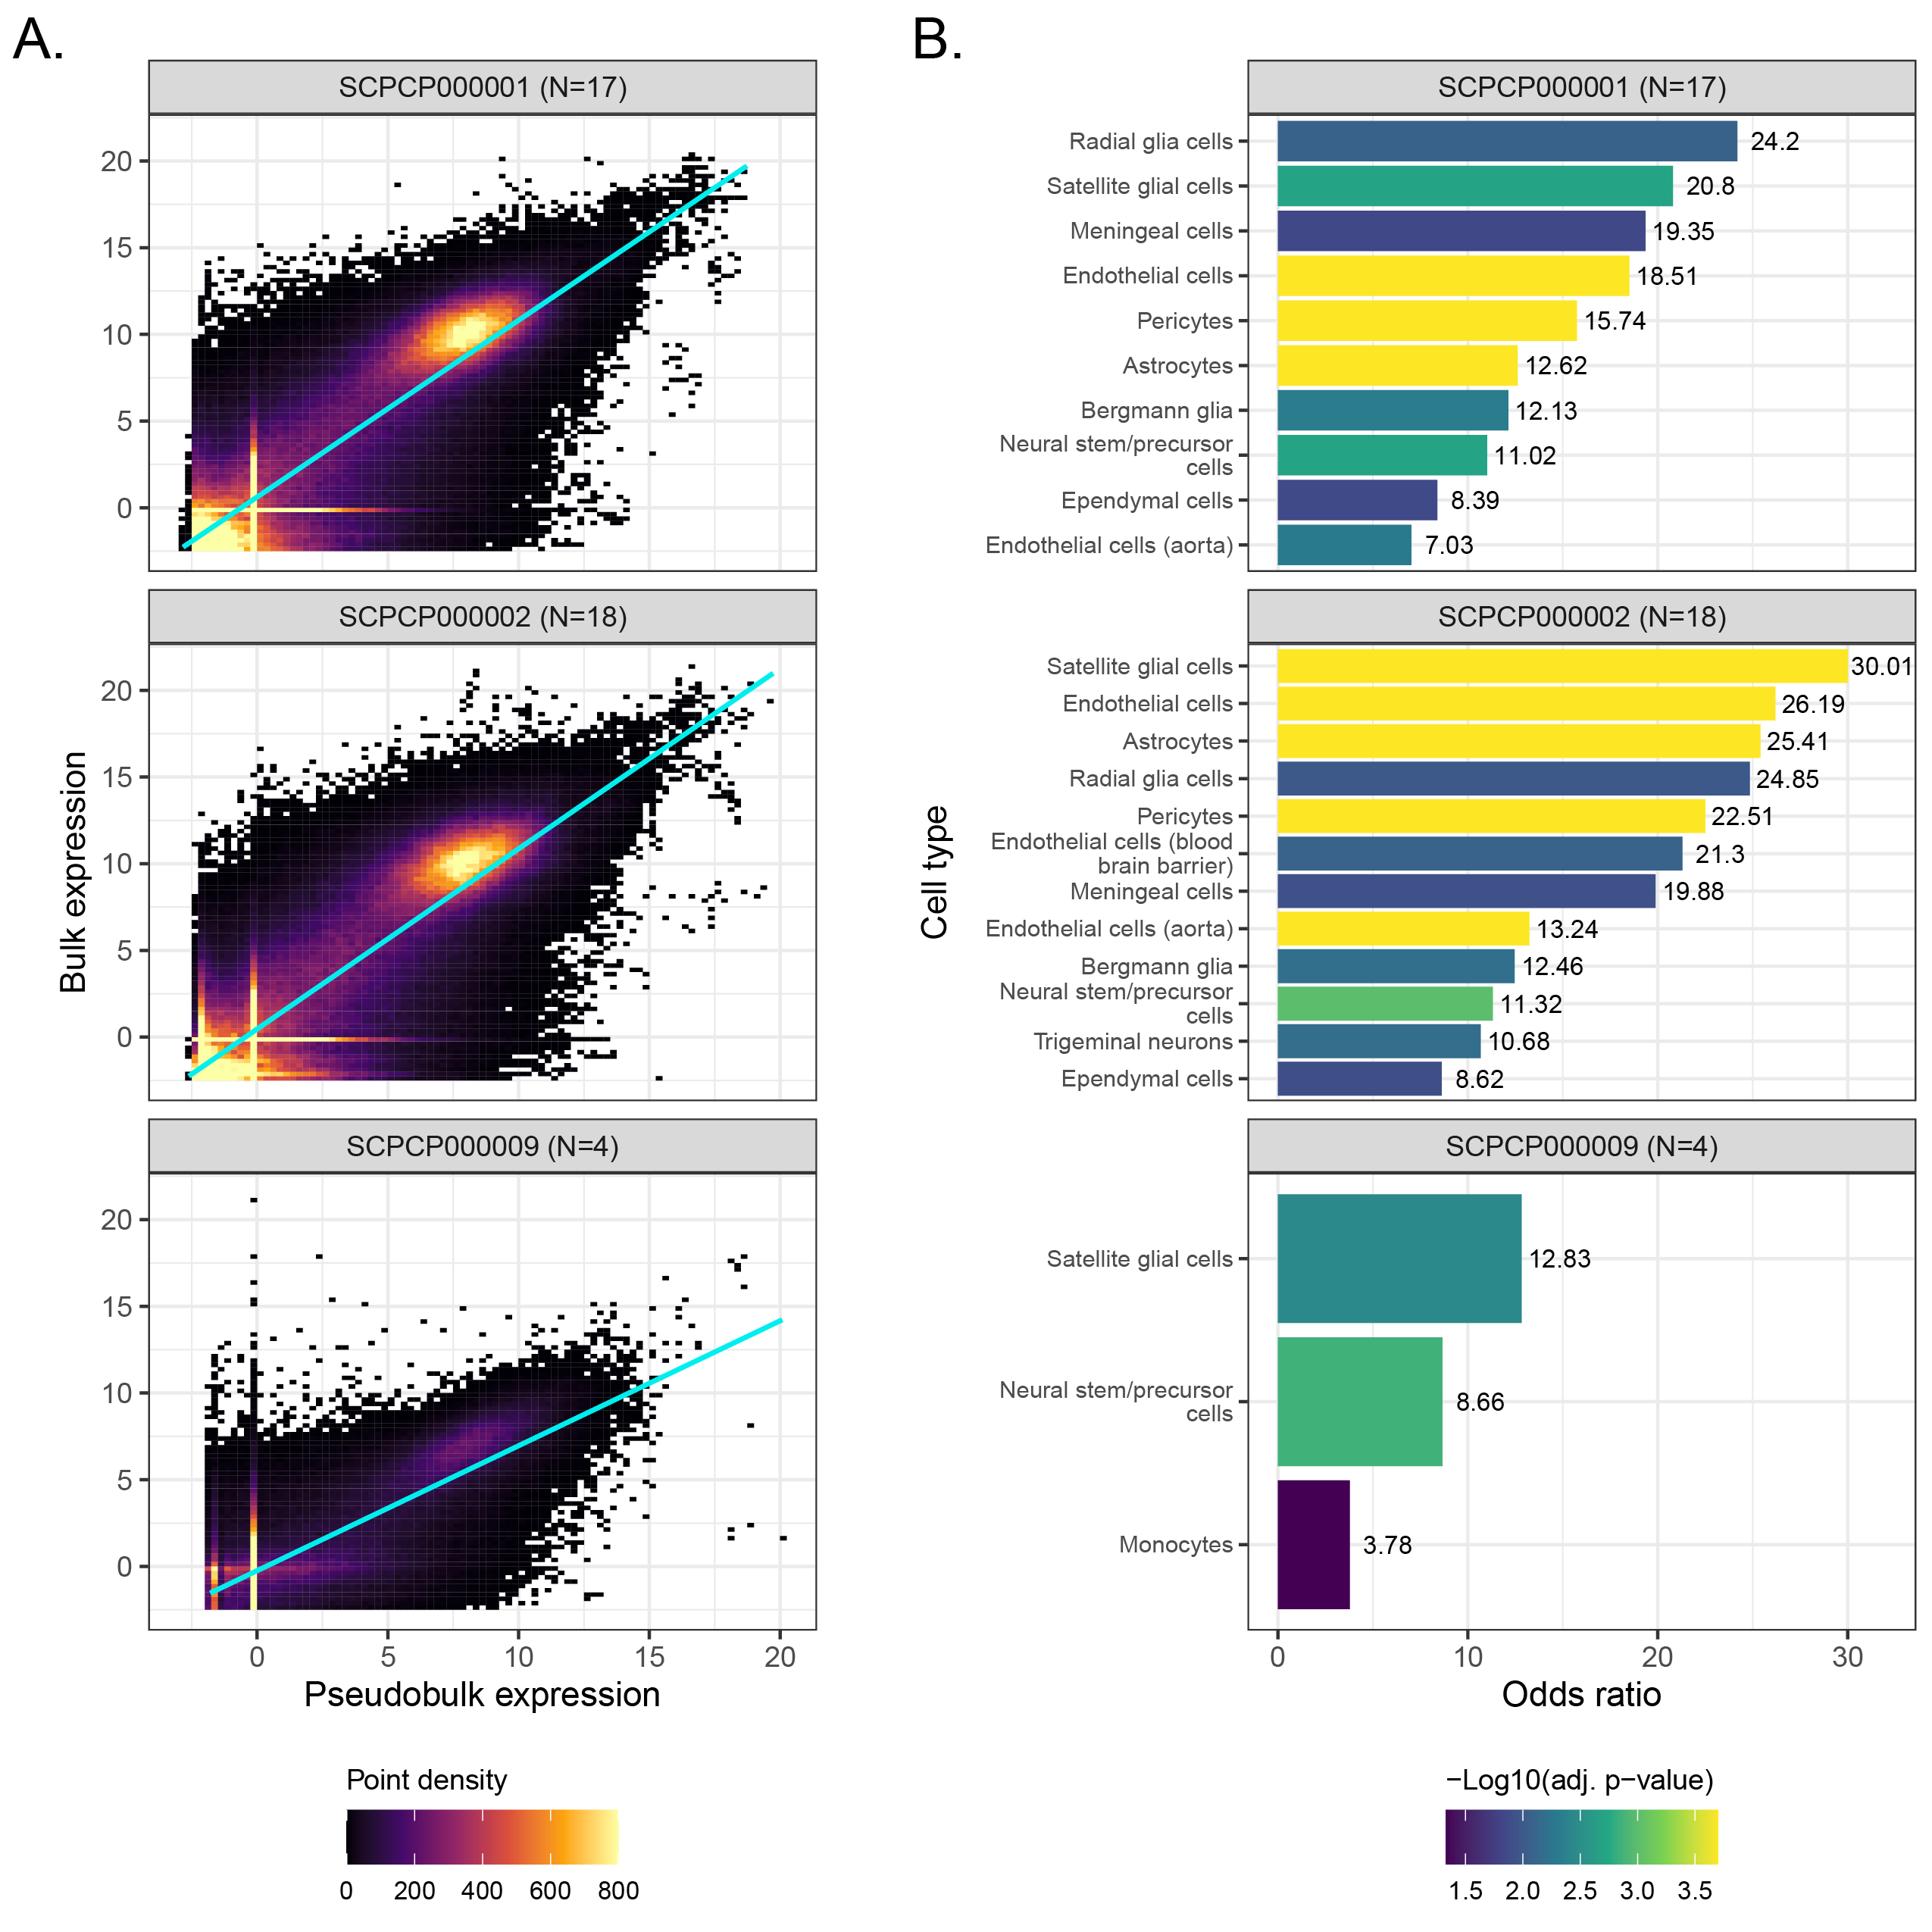
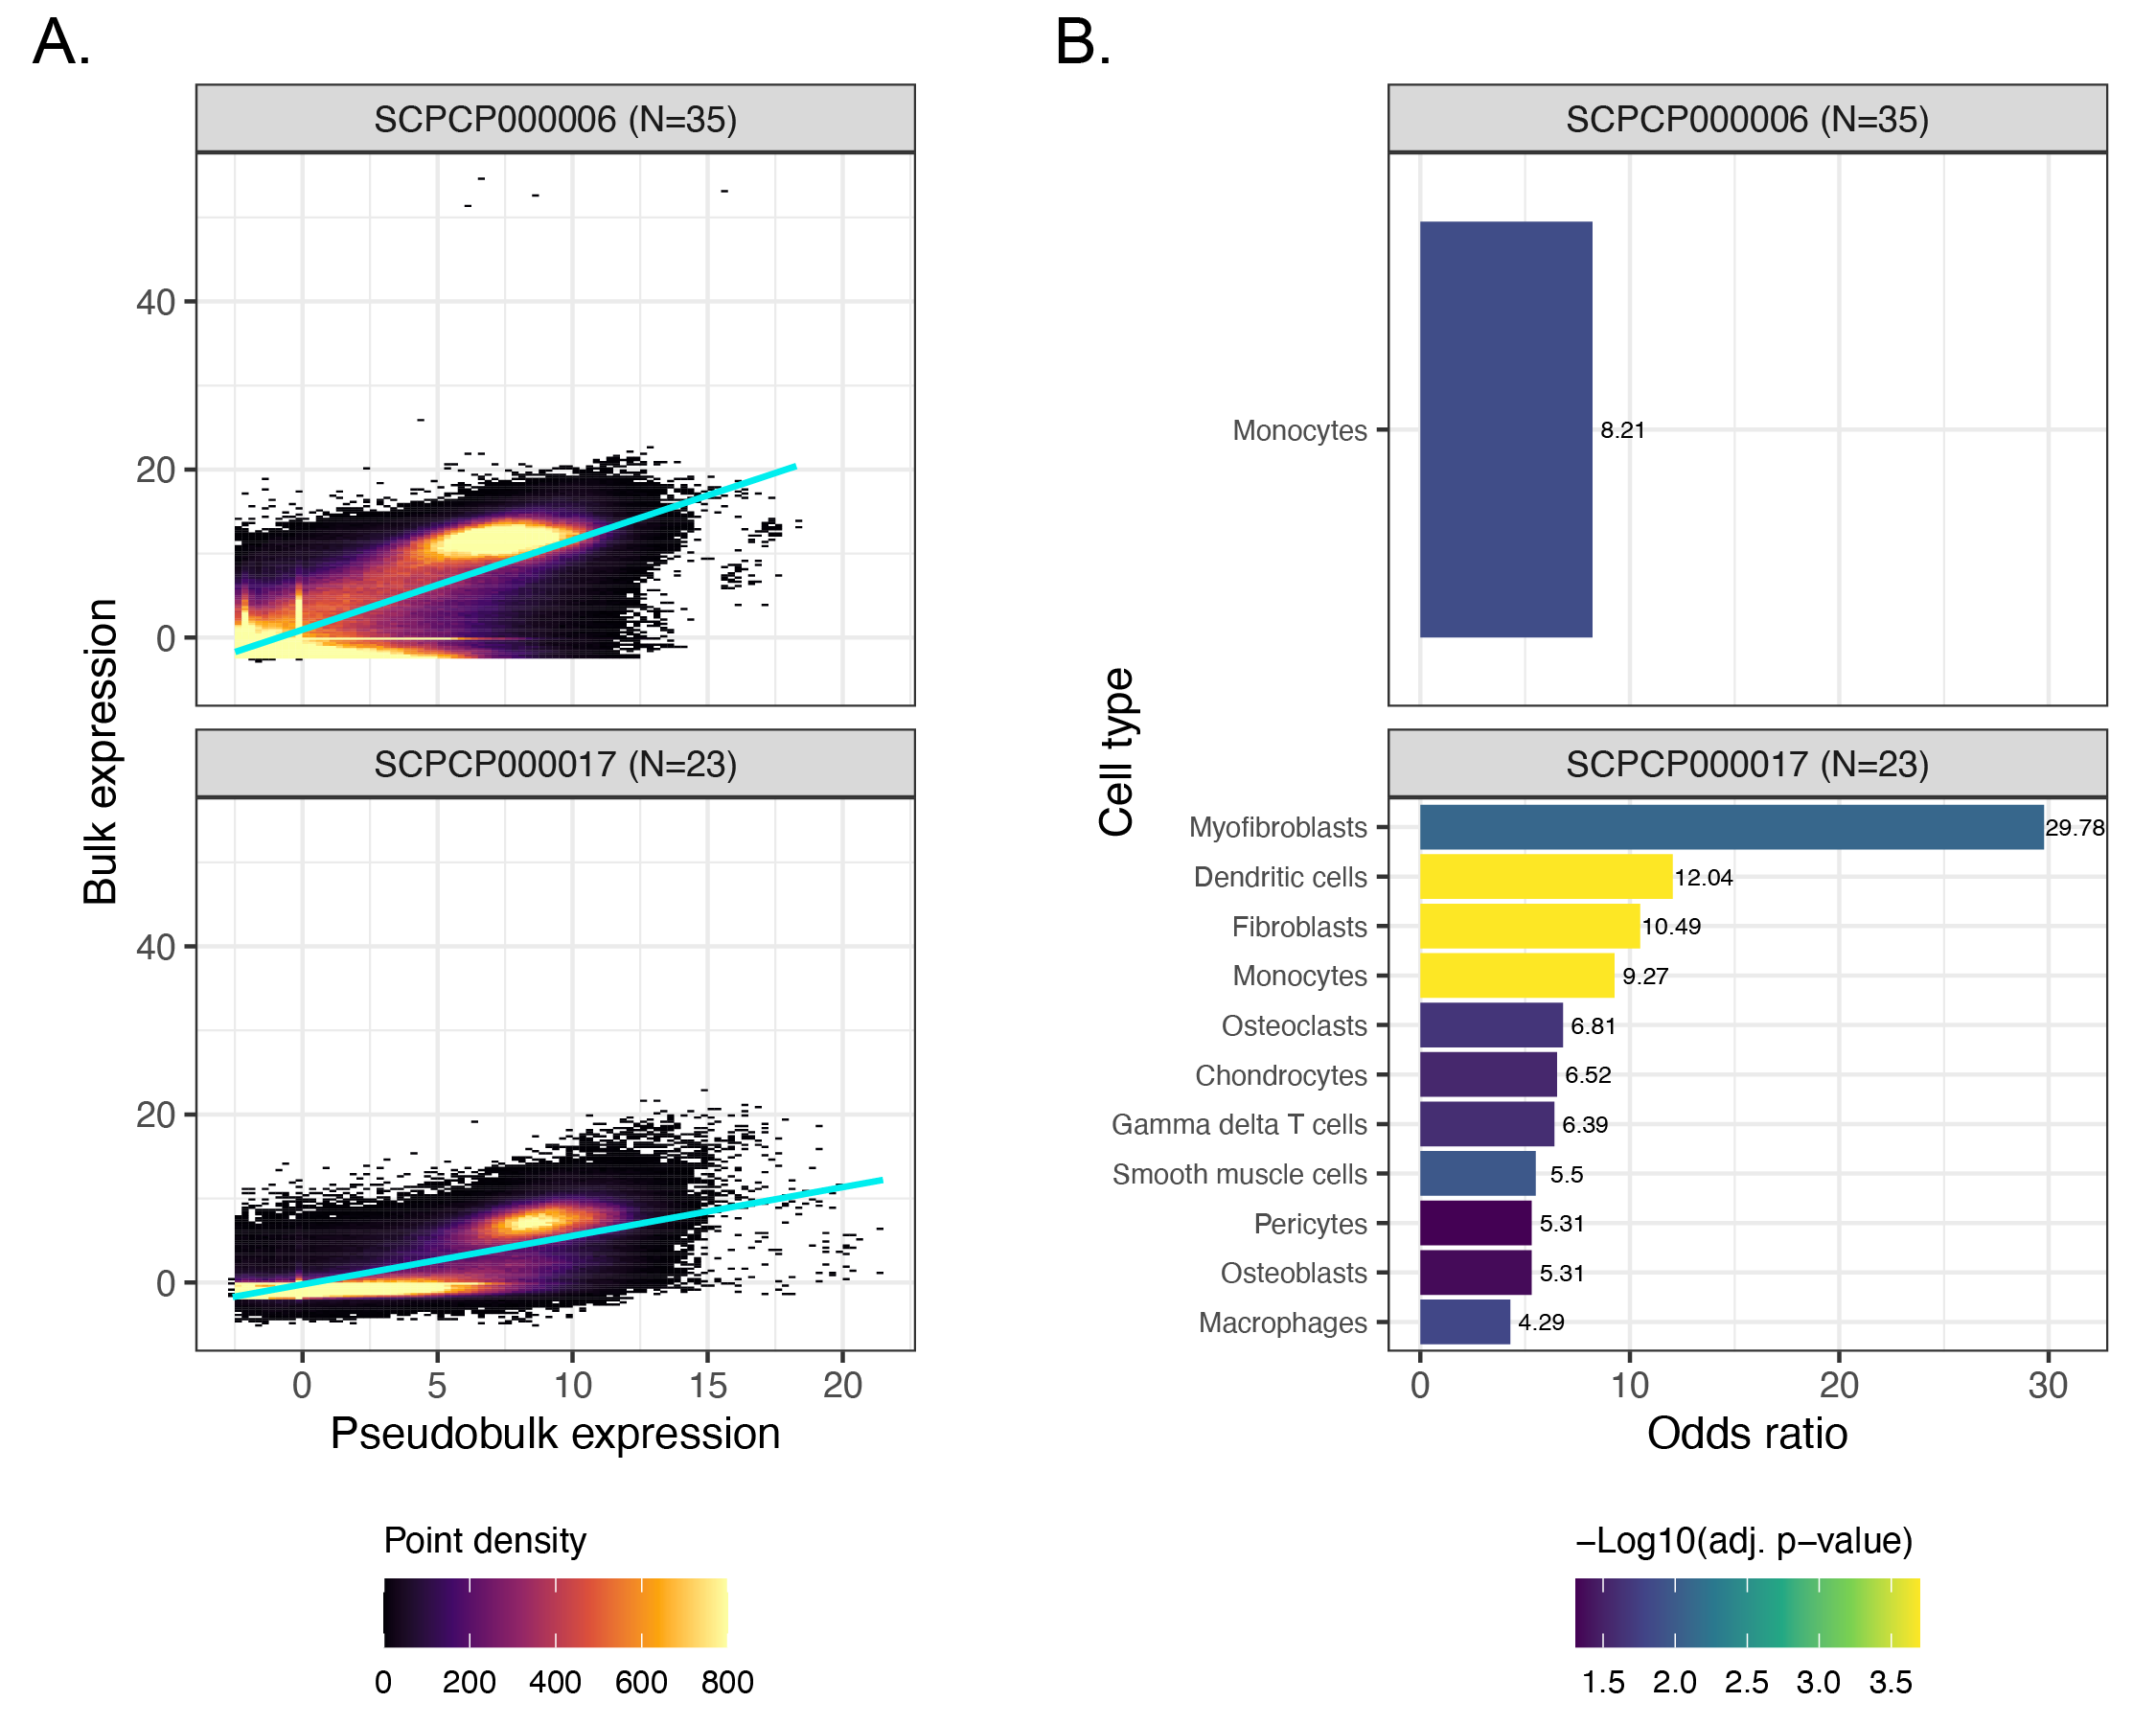
As described in the Methods, we derived pseudobulk expression matrices for each single-cell or single-nuclei library and compared the pseudobulk expression to bulk using a series of linear models (one per ScPCA project) with a random effect controlling for sample (Figure 6A, Figure S7A).
Across all projects, we observed a positive relationship between bulk and pseudobulk expression, consistent with our expectations.
We next performed an overrepresentation analysis to probe for differences in gene expression that might suggest differences in cell type composition and/or abundance between modalities.
To this end, we calculated the per-gene median of each project’s model residuals and identified outliers, where “positive outliers” are genes with higher bulk RNA-seq expression than expected from pseudobulk expression, and conversely “negative outliers” are genes with lower bulk RNA-seq expression than expected from pseudobulk expression.
Using cell type marker gene sets from each project’s respective CellAssign reference, we calculated the odds ratio in each direction as the odds a cell type marker gene is present in the given outlier direction compared to other genes.
Following permutation testing and P-value correction to control the FDR at 5%, we found several cell type marker gene sets with higher, but never lower, bulk RNA-seq expression than expected (Figure 6B, Figure S7B).
In brain and CNS tumors, the marker gene sets overrepresented in bulk RNA-seq expression primarily corresponded to stromal (e.g., Endothelial cells and Pericytes) and/or neuronal cell types (e.g., Astrocytes and various types of glial cells), all of which are prevalent non-immune cells in glioma tumor microenvironments [69,70] (Figure 6B).
Interestingly, only Monocytes and neuronal cell types, but no stromal cells, were overrepresented in bulk RNA-seq for SCPCP000009 (brain and CNS tumors).
As SCPCP000009 was sequenced at the single-nuclei level but SCPCP000001 (high-grade gliomas) and SCPCP000002 (low-grade gliomas) were sequenced at the single-cell level, this difference may reflect the increased sensitivity of single-cell approaches to detecting immune cells relative to single-nuclei approaches [71].
Indeed, the other single-nuclei projects considered here also identified immune cell types as overrepresented in bulk RNA-seq: Monocytes were identified for SCPCP000006 (Wilms Tumor), and a combination of immune and non-immune cell types were identified for SCPCP000017 (osteosarcoma; Figure S7B).
The diversity of cell types overrepresented in osteosarcoma bulk RNA-seq samples may also reflect inherent challenges in dissociating bone tissue [72].
In total, we observed that while bulk and single-cell or single-nuclei expression is indeed highly correlated, cell type differences may still be present between modalities potentially influenced by cell-type-specific loss in single-cell experiments.
Methods
Data generation and processing
Raw data and metadata were generated and compiled by each lab and institution contributing to the Portal.
Single-cell or single-nuclei libraries were generated using one of the commercially available kits from 10x Genomics.
For bulk RNA-seq, RNA was collected and sequenced using either paired-end or single-end sequencing.
For spatial transcriptomics, cDNA libraries were generated using the Visium kit from 10x Genomics.
All libraries were processed using our open-source pipeline, scpca-nf, to produce summarized gene expression data.
A detailed summary with the total number of samples and libraries collected for each sequencing method broken down by project is available in Table S1.
Metadata
Submitters were required to submit the age, sex, organism, diagnosis, subdiagnosis (if applicable), disease timing (e.g., initial diagnosis) and tissue of origin for each sample.
The submitted metadata was standardized across projects, including converting all ages to years, removing abbreviations used in diagnosis, subdiagnosis, or tissue of origin, and using standard values across projects as much as possible for diagnosis, subdiagnosis, disease timing, and tissue of origin.
For example, all samples obtained at diagnosis were assigned the value Initial diagnosis for disease timing.
In an effort to ensure sample metadata for ScPCA are compatible with CZI’s CELLxGENE, ontology term identifiers were assigned to metadata categories for each sample following the guidelines present in the CELLxGENE schema [73,74], as shown in Table 1.
Table 1: Assignment of metadata fields to ontology terms.
Metadata field
Ontology term description
Age
Ontology term obtained from HsapDv [16]. For ages 0-11 months, the HsapDv for age in months was used. For ages 12 months and greater, the HsapDv for age in years was used.
Sex
Ontology term obtained from PATO, either male (PATO:0000384), female (PATO:0000383), or unknown [17,18].
Organism
NCBI taxonomy term for organism. All current samples available on the Portal are from Homo sapiens or NCBITaxon:9606 [19,20].
Diagnosis
The most appropriate MONDO term based on the provided diagnosis [21,22]. An exact match was identified for most samples, but in a handful of cases, the most closely related term was used.
Tissue of origin
The most appropriate UBERON term based on the provided tissue of origin [23,24,25]. An exact match was identified for most samples, but in a handful of cases, the most closely related term was used.
Ethnicity (if applicable)
If the submitter provided ethnicity, the associated Hancestro term [26,27]. If ethnicity is unavailable, unknown is used.
The majority (87%) of projects on the Portal have additional metadata fields, such as the presence or absence of treatment, tumor grade, or whether a sample was obtained from a primary tumor or metastasis.
Ethics statement
For ALSF-funded datasets comprised of human subjects data, Institutional Review Boards (IRB) or research ethics boards at grantee institutions approved the research or determined it was exempt.
For community-contributed datasets containing summarized data and de-identified metadata from human subjects, submitting institutions certified that all approvals and consents were obtained or listed the IRB protocol in transfer agreements.
ALSF-funded xenograft datasets were approved by the grantee institution’s Institutional Animal Care and Use Committee.
Processing single-cell and single-nuclei RNA-seq data with alevin-fry
To quantify RNA-seq gene expression for each cell or nucleus in a library, scpca-nf uses salmon alevin[75] and alevin-fry[15] to generate a gene-by-cell counts matrix.
Prior to mapping, we generated an index using transcripts from both spliced cDNA and unspliced cDNA sequences, denoted as the splici index [15].
The index was generated from the human genome, GRCh38, Ensembl version 104.
salmon alevin was run using selective alignment to the splici index with the --rad option to generate a reduced alignment data (RAD) file required for input to alevin-fry.
The RAD file was used as input to the recommended alevin-fry workflow, with the following customizations.
At the generate-permit-list step, we used the --unfiltered-pl option to provide a list of expected barcodes specific to the 10x kit used to generate each library.
The quant step was run using the cr-like-em resolution strategy for feature quantification and UMI de-duplication.
Post alevin-fry processing of single-cell and single-nuclei RNA-seq data
The output from running alevin-fry includes a gene-by-cell counts matrix, with reads from both spliced and unspliced reads for all potential cell barcodes.
The gene-by-cell counts matrix is read into R to create a SingleCellExperiment object using fishpond::load_fry().
The resulting object contains a counts assay with a gene-by-cell counts matrix where all spliced and unspliced reads for a given gene are totaled together.
We also include a spliced assay that contains a gene-by-cell counts matrix with only spliced reads.
These matrices include all potential cells, including empty droplets, and are provided for all Portal downloads in the unfiltered objects saved as .rds files with the _unfiltered.rds suffix.
Each droplet was tested for deviation from the ambient RNA profile using DropletUtils::emptyDropsCellRanger()[45,76] and those with an FDR ≤ 0.01 were retained as likely cells.
If a library did not have a sufficient number of droplets and DropletUtils::emptyDropsCellRanger() failed, cells with fewer than 100 UMIs were removed.
Gene expression data for any cells that remain after filtering are provided in the filtered objects saved as .rds files with the _filtered.rds suffix.
These filtered objects additionally contain results from doublet detection performed with scDblFinder::scDblFinder()[77], including each cell’s predicted class (“singlet” or “doublet”) as well as the associated doublet score.
However, predicted doublets were not filtered out; users can instead use these scDblFinder results to filter doublets as needed for their specific analysis needs.
Following removal of empty droplets, scpca-nf proceeds to remove cells that are likely to be compromised by damage or low-quality sequencing.
miQC was used to calculate the posterior probability that each cell is compromised [46].
Any cells with a probability of being compromised greater than 0.75 and fewer than 200 genes detected were removed before further processing.
The gene expression counts from the remaining cells were log-normalized using the deconvolution method from Lun, Bach, and Marioni [47].
Briefly, scran::quickCluster() was used to derive cell clusters on which to calculate sum factors with scran::computeSumFactors(), which are in turn used during normalization with scuttle::logNormCounts().
If this deconvolution-based approach failed for any reason, only scuttle::logNormCounts() was used for normalization.
Next, scran::modelGeneVar() was used to model gene variance from the log-normalized counts and scran::getTopHVGs() was used to select the top 2000 high-variance genes.
These were used as input to calculate the top 50 principal components using scater::runPCA().
Finally, UMAP embeddings were calculated from the principal components with scater::runUMAP().
The raw and log-normalized counts, list of 2000 high-variance genes, principal components, and UMAP embeddings are all stored in the processed objects saved as .rds files with the _processed.rds suffix.
Quantifying gene expression for libraries with CITE-seq or cell hashing
All libraries with antibody-derived tags (ADTs) or hashtag oligonucleotides (HTOs) were mapped to a reference index using salmon alevin and quantified using alevin-fry.
The reference indices were constructed using the salmon index command with the --feature option.
References were custom-built for each ScPCA project and constructed using the submitter-provided list of ADTs or HTOs and their barcode sequences.
The ADT-by-cell or HTO-by-cell counts matrix produced by alevin-fry were read into R as a SingleCellExperiment object and saved as an alternative experiment (altExp) in the same SingleCellExperiment object with the unfiltered gene expression counts data.
The altExp within the unfiltered object contains all identified ADTs or HTOs and all barcodes identified in the RNA-seq gene expression data.
Any barcodes that only appeared in either ADT or HTO data were discarded, and cell barcodes that were only found in the gene expression data (i.e., did not appear in the ADT or HTO data) were assigned zero counts for all ADTs and HTOs.
Any cells removed after filtering empty droplets were also removed from the ADT and HTO counts matrices and before creating the filtered SingleCellExperiment object.
Processing ADT expression data from CITE-seq
The ADT count matrix stored in the unfiltered object was used to calculate an ambient profile with DropletUtils::ambientProfileEmpty().
The ambient profile was used to calculate quality-control statistics with DropletUtils::cleanTagCounts() for all cells remaining after removing empty droplets.
Any negative or isotype controls were taken into account when calculating QC statistics.
This function flags cells as low-quality if they either have very high levels of ambient contamination and/or negative/isotype controls (if present), or lack ambient expression altogether, which may indicate failed capture.
However, we did not remove any cells based on ADT quality because that would remove those cells from the SingleCellExperiment object, regardless of the quality of the RNA expression.
Instead, the filtered and processed objects contain the results from running DropletUtils::cleanTagCounts(), which users can leverage for filtering as desired.
ADT count data were then normalized using scuttle::computeMedianFactors(), which calculates a per-cell size factor as the median ratio of the cell’s counts to the background profile previously calculated with DropletUtils::ambientProfileEmpty().
We then used these factors to normalize ADT counts with scuttle::logNormCounts().
If median-based normalization failed for any reason, ADT counts were log-transformed after adding a pseudocount of 1.
We only performed normalization on cells that would be retained after ADT filtering; we assigned NA normalized counts to any cells that would be filtered out based on DropletUtils::cleanTagCounts().
The normalized ADT data are available in the altExp of the processed object.
Although scpca-nf normalizes ADT counts, the workflow does not perform any dimensionality reduction of ADT data; only the RNA counts data are used as input for dimensionality reduction.
Additionally, note that we did not perform background subtraction on the ADT counts, but we provide the ambient profile calculated with DropletUtils::ambientProfileEmpty(), which users can employ to perform global de-noising as needed.
During conversion to AnnData objects, the modalities are exported as separate RNA (_rna.h5ad) and ADT (_adt.h5ad) objects.
Processing HTO data from multiplexed libraries
As with ADT data, scpca-nf does not filter any cells based on HTO expression, and any cells removed after filtering empty droplets based on the unfiltered RNA counts matrix are also removed from the HTO counts matrix in the filtered object.
scpca-nf does not perform any additional filtering or processing of the HTO-by-cell counts matrix, so the same filtered matrix is included in the processed object.
To identify which cells come from which sample in a multiplexed library, we applied three different demultiplexing methods: genetic demultiplexing, HTO demultiplexing using DropletUtils::hashedDrops(), and HTO demultiplexing using Seurat::HTODemux().
We do not provide separate SingleCellExperiment objects for each sample in a library.
Each multiplexed library object contains the counts data from all samples and the results from all three demultiplexing methods to allow users to select which method(s) to use.
Genetic demultiplexing
If all samples in a multiplexed library were also sequenced using bulk RNA-seq, we performed genetic demultiplexing using genotype data from both bulk RNA-seq and single-cell or single-nuclei RNA-seq [55].
If bulk RNA-seq was not available, no genetic demultiplexing was performed.
Bulk RNA-seq reads for each sample were mapped to a reference genome using STAR[78], and multiplexed single-cell or single-nuclei RNA-seq reads were mapped to the same reference genome using STARsolo[76].
The mapped bulk reads were used to call variants and assign genotypes with bcftools mpileup[79].
cellsnp-lite was then used to genotype single-cell data at the identified sites found in the bulk RNA-seq data [80].
Finally, vireo was used to identify the sample of origin [80].
HTO demultiplexing
For all multiplexed libraries, we performed demultiplexing using DropletUtils::hashedDrops() and Seurat::HTODemux().
For both methods, we used the default parameters and only performed demultiplexing on the filtered cells present in the filtered object.
The results from both these methods are available in the filtered and processed objects.
Quantification of spatial transcriptomics data
10x Genomics’ Space Ranger [58] was used to quantify gene expression data from spatial transcriptomics libraries.
cellranger mkref was used to create a reference index from the human genome, GRCh38, Ensembl version 104.
The FASTQ files, microscopic slide image, and slide serial number were provided as input to spaceranger count.
The raw and filtered counts matrix, slide images, and the summary report output by spaceranger count are included in the output from scpca-nf.
Quantification of bulk RNA-seq data
fastp was used to trim adapters and perform quality and length filtering on all FASTQ files from bulk RNA-seq.
We used a decoy-aware reference created from spliced cDNA sequences with the entire human genome sequence (GRCh38, Ensembl version 104) as the decoy [57].
The trimmed reads were then provided as input to salmon quant for selective alignment.
In addition to using the default parameters for salmon quant, we applied the --seqBias and --gcBias flags to correct for sequence-specific biases due to random hexamer priming and fragment-level GC biases, respectively.
Cell type annotation
Cell type labels determined by SingleR[49], CellAssign[50], and SCimilarity[51] were added to processed SingleCellExperiment objects.
If cell types were obtained from the submitter of the dataset, the submitter-provided annotations were incorporated into all SingleCellExperiment objects (unfiltered, filtered, and processed).
To prepare the references used for assigning cell types, we developed a separate workflow, build-celltype-index.nf, within scpca-nf.
We used the BlueprintEncodeData reference from the celldex package [81,82] to train the SingleR classification model with SingleR::trainSingleR().
In the main scpca-nf workflow, this model and the processed SingleCellExperiment object were input to SingleR::classifySingleR().
The SingleR output of cell type annotations and a score matrix for each cell and all possible cell types were added to the processed SingleCellExperiment object.
The BlueprintEncodeData reference was chosen because it had either a similar or higher delta median statistic compared to other references available in celldex when applied to samples from a variety of diagnoses.
The delta median statistic for each cell was calculated by subtracting the median cell type score from the score associated with the assigned cell type [83] and was used to evaluate confidence in SingleR cell type assignments.
The cell type report shows the distribution of delta median values for each cell type.
A higher delta median statistic for a cell generally indicates higher confidence in the final cell type annotation.
For CellAssign, marker gene references were created using the marker gene lists available on PanglaoDB[84].
Organ-specific references were built using all cell types in a specified organ listed in PanglaoDB to accommodate all ScPCA projects encompassing a variety of disease and tissue types.
If a set of disease types in a given project encompassed cells that may be present in multiple organ groups, multiple organs were combined.
Since many cancers may have infiltrating immune cells, all immune cells were also included in each organ-specific reference.
For example, we created a reference containing bone, connective tissue, smooth muscle, and immune cells for sarcomas that appear in bone or soft tissue.
Given the processed SingleCellExperiment object and organ-specific reference, scvi.external.CellAssign() was used in the main scpca-nf workflow to train the model and predict the assigned cell type.
For each cell, CellAssign calculates a probability of assignment to each cell type in the reference.
The probability matrix and a prediction based on the most probable cell type were added as cell type annotations to the processed SingleCellExperiment object.
We also display the distribution of all probabilities calculated by CellAssign in the cell type report; more confident labels are expected to have many values close to 1.
For SCimilarity, the foundation model described in Heimberg et al. [51] containing 7.3 million cells from various normal and diseased tissues was obtained from Zenodo (https://zenodo.org/records/10685499) and used to annotate cells in all samples.
The assigned cell type label and the distance of the query cell to the closest cell in the model were added to the processed SingleCellExperiment object.
A plot showing the distribution of the distance metric calculated by SCimilarity is present in the cell type report.
Distances larger than 0.05 can indicate that the model is less confident in the prediction.
Assigning consensus cell types
Cell type labels obtained from SingleR, CellAssign, and SCimilarity were then used to assign an ontology-aware consensus cell type label.
We first assigned each of the cell types present in the PanglaoDB[84] reference used with CellAssign to an appropriate Cell Ontology term [85].
For cell types available in the BlueprintEncodeData reference used with SingleR and the foundation model used with SCimilarity, we used the provided Cell Ontology terms.
We then created a reference table containing all possible combinations of cell types assigned using SingleR, CellAssign, and SCimilarity.
Consensus cell types are assigned if two of the three annotations share a latest common ancestor (LCA), identified using ontoProc::findCommonAncestors()[86], that meets the following criteria.
Otherwise, no consensus cell type is assigned, and the cell is labeled as “Unknown”.
The terms share at least 1 LCA that either has fewer than 170 descendants or is one of “neuron”, “epithelial cell”, “columnar/cuboidal epithelial cell”, or “endo-epithelial cell”.
If more than 1 LCA is shared between two terms, then the LCA with the fewest descendants is kept and all others are discarded.
If the LCA has fewer than 170 descendants and is one of the following non-specific LCA terms, no consensus cell type is assigned: “bone cell”, “lining cell”, “blood cell”, “progenitor cell”, “supporting cell”, “biogenic amine secreting cell”, “protein secreting cell”, “extracellular matrix secreting cell”, “serotonin secreting cell”, “peptide hormone secreting cell”, “exocrine cell”, “sensory receptor cell”, or “interstitial cell”.
If more than one LCA is identified as a possible consensus cell type, meaning there is agreement among all three methods, the LCA with the fewest descendants is used as the consensus cell type.
The consensus cell type assignments, including both the Cell Ontology term and the associated human-readable name, are available in processed object files on the Portal.
Consensus cell type assignments were evaluated by looking at marker gene expression in a set of cell-type specific marker genes.
Marker genes were obtained from the list of Human cell markers on CellMarker 2.0[87].
We considered only those that are specific to a single cell type, with the exception of hematopoietic precursor cells, which express genes found in other, more differentiated immune cells.
Cell types annotated as part of the OpenScPCA Project
As part of the ongoing OpenScPCA project [64], cell types for each project are manually annotated to label disease-specific cell types or cell states.
After annotations for all samples in a given project have been validated, they are added to all SingleCellExperiment objects (unfiltered, filtered, and processed) for that project on the Portal.
To date, cell types have been assigned and validated for SCPCP000004 (neuroblastoma) and SCPCP000015 (Ewing sarcoma).
The approaches for cell type annotation were originally developed in the OpenScPCA-analysis GitHub repository [88] in the cell-type-neuroblastoma-04 and cell-type-ewings analysis modules, respectively.
These analysis modules provide full information on the specific approaches used for annotation.
The cell type annotations included in the ScPCA Portal were subsequently generated in corresponding Nextflow modules in the OpenScPCA-nf GitHub repository [89].
Copy-number variation inference
We used inferCNV[52] with the i6 HMM to estimate copy-number variation (CNV) events for each library, for each chromosome arm.
We designated a set of normal consensus cell types to use for each library’s normal reference based on the given sample’s diagnosis.
All libraries were processed with inferCNV except: i) libraries without assigned consensus cell types, ii) libraries with fewer than 100 normal reference cells, and iii) libraries from non-cancerous samples.
We calculated the total CNVs per cell using the feature output from the i6 HMM by summing CNV calls across all chromosome arms.
Generating merged data
Merged objects are created with the merge.nf workflow within scpca-nf.
This workflow takes as input the processed SingleCellExperiment objects in a given ScPCA project output by scpca-nf and creates a single merged SingleCellExperiment object containing gene expression data and metadata from all libraries in that project.
The merged object includes both raw and normalized counts for all cells from all libraries.
Because the same reference index was used to quantify all single-cell and single-nuclei RNA-seq data, the set of genes is the same in the merged object and the individual objects.
Library-, cell- and gene-specific metadata from each of the processed SingleCellExperiment objects are also combined and stored in the merged object.
The merge.nf workflow does not perform batch correction or integration, so the counts in the merged object are not batch-corrected.
The top 2000 shared high-variance genes are identified from the merged counts matrix by modeling variance using scran::modelGeneVar() and specifying library IDs for the block argument.
These genes are used to calculate library-aware principal components with batchelor::multiBatchPCA()[90].
The top 50 principal components were selected and used to calculate UMAP embeddings for the merged object.
If any libraries included in the ScPCA project contain additional ADT data, the raw and normalized ADT data are also merged and stored in the altExp slot of the merged SingleCellExperiment object.
If the merged object contains an altExp with merged ADT data, two AnnData objects are exported to create separate RNA (_rna.h5ad) and ADT (_adt.h5ad) objects.
If any libraries in the ScPCA project are multiplexed and contain HTO data, no merged object is created due to potential ambiguity in identifying samples across multiplexed libraries.
Merged objects were not created for projects with more than 100 samples because of the computational resources required to work with them.
Converting SingleCellExperiment objects to AnnData objects
zellkonverter::writeH5AD()[91] was used to convert SingleCellExperiment objects to AnnData format and export the objects as .h5ad files.
For any SingleCellExperiment objects containing an altExp (e.g., ADT data), the RNA and ADT data were exported and saved separately as RNA (_rna.h5ad) and ADT (_adt.h5ad) files.
Multiplexed libraries were not converted to AnnData objects, due to the potential for ambiguity in sample origin assignments.
All merged SingleCellExperiment objects were converted to AnnData objects and saved as .h5ad files.
If a merged SingleCellExperiment object contained any ADT data, the RNA and ADT data were exported and saved separately as RNA (_rna.h5ad) and ADT (_adt.h5ad) objects.
In contrast, if a merged SingleCellExperiment object contained HTO data due to the presence of any multiplexed libraries in the merged object, the HTO data was removed from the SingleCellExperiment object and not included in the exported AnnData object.
Analysis of bulk RNA-seq data
Data preparation
We identified solid tumor samples with both bulk and single-cell (or single-nuclei) RNA-seq data in the ScPCA Portal for analysis, with multiplexed samples excluded (N=105).
We removed low-quality samples based on visual inspection of quality control reports (N=8), leaving a total of 97 samples across five ScPCA projects for analysis.
For each project, we transformed and normalized bulk counts matrices for all samples using DESeq2::rlog()[92].
We obtained pseudobulk counts by summing raw single-cell counts for each sample, and similarly transformed each project’s resulting counts matrix with DESeq2::rlog().
We filtered out genes which were not observed in either the bulk or pseudobulk raw counts matrices before subsequent analysis.
For each project, we then used the lme4 R package [93] to construct a linear model predicting bulk from pseudobulk counts considering a random effect for sample id: bulk ~ pseudobulk + (1|sample_id).
Overrepresentation analysis
We next conducted overrepresentation analysis (ORA) to ascertain whether certain cell types might be overrepresented either modality (bulk vs. pseudobulk).
We specifically tested overrepresentation of the PanglaoDB cell type marker gene sets used for each project’s respective CellAssign reference.
For input to the ORA, we summarized model residuals within each project by taking the median residual for each gene across samples and then transformed these summarized residuals into Z-scores.
We identified outlier genes as those with Z-scores greater than 2.5 (positive outliers) or less than -2.5 (negative outliers).
In this case, positive outliers represent genes with comparatively higher expression in the bulk modality, and negative outliers represent genes with comparatively higher expression in the single-cell modality.
For each set of cell type marker genes, we calculated two odds ratios representing whether genes were overrepresented in the positive outliers (enriched in bulk) or negative outliers (enriched in pseudobulk).
We calculated P-values for both the bulk and pseudobulk enrichment directions via permutation testing with 10,000 replicates.
We defined gene sets with significant overrepresentation as those with a false-discovery-rate-corrected P-value ≤ 0.05 [94].
Code and data availability
All summarized gene expression data and de-identified metadata are available for download on the ScPCA Portal, https://scpca.alexslemonade.org/.
The ScPCA Portal is a downloadable collection of uniformly processed, summarized single-cell and single-nuclei RNA-seq data and de-identified metadata from pediatric tumor samples.
The Portal includes over 700 samples from 55 tumor types, making this the most comprehensive collection of publicly available single-cell RNA-seq datasets from pediatric tumor samples to our knowledge.
Users can browse and search the Portal via an intuitive web interface and access visualizations of individual samples via a UCSC Cell Browser interface [39].
Summarized data are available at three different processing stages: unfiltered, filtered, or processed objects.
Users can choose to start from a processed object or perform their own processing, such as filtering and normalization.
Processed objects contain normalized gene expression data, reduced dimensionality results from PCA and UMAP, and cell type annotations.
Standardized metadata, containing human-readable values for all fields and ontology term identifiers for a subset of metadata fields, is included in a separate metadata file and within the data objects for all samples.
Every library includes a quality control report, which lets users assess data quality and identify low-quality libraries that they may wish to exclude from further downstream analyses.
The availability of processed results and metadata saves time and effort for researchers, allowing them to move directly to downstream analyses, such as identifying marker genes or exploring genes of interest.
Data on the Portal is available as either SingleCellExperiment or AnnData objects so that users can work in R or Python with the downloaded data using common analysis systems such as Bioconductor or Scanpy, depending on their preference.
Providing data as AnnData objects also means users can easily integrate ScPCA data with data and tools available on other platforms.
In particular, the format of the provided AnnData objects is designed to be mostly compliant with the requirements of CZI CELLxGENE [5,6,95], but these objects can also be used with UCSC Cell Browser [39,96] or Kana [97,98].
Data can be downloaded both via the Portal web interface and programmatically using the ScPCAr R package, which is a wrapper for the ScPCA Portal API (https://api.scpca.alexslemonade.org/docs/).
Additionally, users can download a merged SingleCellExperiment or AnnData object containing all gene expression data and metadata from all samples in a project, which supports multi-sample analyses such as differential gene expression or gene set enrichment.
To provide users with cell type annotations, we applied three automated methods: SingleR, CellAssign, and SCimilarity.
The first two approaches use publicly available references, while the third uses a foundation model to label cells.
We then used the correspondence among these three methods to derive ontology-aware consensus cell type labels, thereby providing a consistent labeling scheme across samples that may support annotating populations of normal cells that may be present in tumor samples.
A limitation of this approach is that neither of the references used for SingleR or CellAssign considered tumor cells.
However, providing consensus labels saves users time and effort and allows them to focus on cell types that are likely to be poorly assigned [99] using our approach, such as tumor cells.
To address the limitations of consensus cell type assignment, we provide CNV estimates from InferCNV for approximately half of the libraries in the Portal.
Joint information from consensus cell type annotations and CNV estimates may support researchers to identify and interrogate tumor cells, in particular for diagnoses where copy number alterations are common such as neuroblastoma (Figure 5B-D) or osteosarcoma.
Beyond the automated and consensus cell type annotations, two projects (SCPCP000004 comprised of neuroblastoma samples, and SCPCP000015 comprised of Ewing sarcoma samples) include an additional set of cell type annotations from the ongoing OpenScPCA project [64].
Unlike annotations made within the scpca-nf pipeline, these labels include formal identification of normal vs. tumor cells.
All of the annotation methods used in OpenScPCA are all fully open-source, enabling transparency, reproducibility, and reuse by the research community.
Moving forward, we will continue to expand the set of projects on the Portal with cell type annotations from the OpenScPCA project, further enriching the Portal with high-quality, well-documented annotations that support scientific discovery.
Many samples on the Portal have additional sequencing data, including ADT data from CITE-seq, cell hashing data, bulk RNA-seq, or spatial transcriptomics.
This enables users to gather more information about a single sample than they could from single-cell or single-nuclei RNA-seq alone.
For example, the ADT data provides information about cell-surface protein expression in individual cells, which can help determine cell types and correlate RNA to protein expression [35].
Spatial transcriptomics data can be combined with matching single-cell RNA-seq to deconvolute the lower-resolution spatial data, to gain more insights about distribution of cell types in the tissue [100].
Similarly, users can gain more insight from bulk RNA-seq data available on the Portal by integrating with single-cell RNA-seq data from the same sample [101,102].
The single-cell RNA-seq data available on the Portal can also be used to deconvolute existing bulk RNA-seq datasets, allowing researchers to infer the abundance of different cell types or cell states in bulk RNA-seq data.
Our analysis of this data showed that while expression is generally consistent between matched bulk RNA-seq and single-cell or single-nuclei libraries in the Portal, there are potential differences in cell type composition between modalities that may reflect technological differences in sample and library preparation (Figure 6, Figure S7).
The ScPCA Portal enables multimodal comparisons that reveal biological and/or technical signals that would otherwise not be apparent from one sequencing modality alone.
We also introduced our open-source and efficient workflow for uniformly processing datasets available on the Portal, scpca-nf, which is available to the entire research community.
In one command, scpca-nf can process raw data from various sequencing types, turning FASTQ files into processed SingleCellExperiment or AnnData objects ready for downstream analyses.
Using Nextflow as the framework for scpca-nf with container images for each process makes the workflow modular and portable.
This makes it easy to add support for more modalities in the future, such as single-cell ATAC-seq, and allows others to run the workflow on their samples in their computing environment, maintaining the security of protected raw data.
Processed output from running scpca-nf on samples from pediatric tumors, cell lines, or other model organisms is eligible for submission to the ScPCA Portal, enabling us to continue to grow the Portal, improving its utility to the research community.
Data available on the ScPCA Portal can further be used for external data analyses, for example, to support re-analyzing any existing pediatric cancer datasets with bulk RNA-seq, such as the Pediatric Brain Tumor Atlas [103,104].
This allows researchers to glean more insight from previously published data without obtaining additional samples, saving time and money and advancing biomedical research.
Acknowledgments
We thank the data generators and submitters of the Single-cell Pediatric Cancer Atlas.
We also thank Anna Greene for her role in constructing the Single-cell Pediatric Cancer Atlas funding opportunity.
This work was funded through the Alex’s Lemonade Stand Foundation Childhood Cancer Data Lab and Childhood Cancer Data Lab Postdoctoral Fellowship (SMF).
Author Contributions
Author
Contributions
Allegra G. Hawkins
Methodology, Software, Investigation, Validation, Formal analysis, Data curation, Writing - Original Draft, Writing - Review & Editing, Visualization
Joshua A. Shapiro
Methodology, Software, Investigation, Validation, Formal analysis, Resources, Data curation, Writing - Original Draft, Writing - Review & Editing, Visualization
Stephanie J. Spielman
Methodology, Software, Investigation, Validation, Formal analysis, Data curation, Writing - Original Draft, Writing - Review & Editing, Visualization
Conceptualization, Methodology, Investigation, Validation, Data curation, Writing - Original Draft, Writing - Review & Editing, Visualization, Supervision, Project administration
Declarations of Interest
AGH, JAS, SJS, DSM, DVP, NI, AY, AMG, KGW, CJB, JO, and JNT are or were employees of Alex’s Lemonade Stand Foundation, a sponsor of this research.
Figure Titles and Legends
Figure 1:Overview of ScPCA Portal contents.
A. Barplots showing sample counts across four main cancer groupings in the ScPCA Portal with the total number of samples for each cancer type displayed to the right of each bar.
Each bar is colored based on the number of samples with the indicated disease timing.
B. Barplot showing sample counts across types of modalities present in the ScPCA Portal.
All single-cell or single-nuclei samples in the Portal are shown under the “All Samples” heading.
Samples under the “Samples with additional modalities” heading represent a subset of the total samples with the given additional modality.
Colors shown for each additional modality indicate the suspension type used, either single-cell or single-nuclei RNA-seq.
For example, 75 single-cell samples and 101 single-nuclei samples have accompanying bulk RNA-seq data.
Two samples were sequenced using both single-cell and single-nuclei suspensions, so each is included in the count for both “Single-cell” and “Single-nuclei” groups.
Samples that were sequenced with either bulk RNA-seq or spatial transcriptomics and do not have accompanying single-cell or single-nuclei RNA-seq data are not shown in this figure.
C. Example of a project card as displayed on the “Browse” page of the ScPCA Portal and a “Visualize” view for a library within that project, colored by consensus cell type annotation.
This project card and visualized sample are from project SCPCP000004[105,106].
Project cards include information about the number of samples, technologies and modalities, additional sample metadata information, submitter-provided diagnoses, and a submitter-provided abstract.
Where available, submitter-provided citation information, as well as other databases where this data has been deposited, are also provided.
The visualization employs the UCSC Cell Browser [39], which allows interactive exploration of the UMAP embeddings for each cell, with user-selectable coloring options that include cell types, gene-level expression, and other per-cell annotations created by the scpca-nf workflow.
Figure 2:Overview of the scpca-nf workflow and download file structures.
A. Overview of scpca-nf, the primary workflow for processing single-cell and single-nuclei RNA-seq data for the ScPCA Portal.
Mapping is first performed with alevin-fry to generate a gene-by-cell count matrix, which is read into R and converted into a SingleCellExperiment (SCE) object.
This SCE object is exported as the Unfiltered SCE Object before further post-processing.
Next, empty droplets are filtered out, and the resulting SCE is exported as the Filtered SCE Object.
The filtered object undergoes additional post-processing, including removing low-quality cells, normalizing counts, and performing dimension reduction with principal components analysis and UMAP.
The object undergoes cell type annotation and CNV inference and is exported as the Processed SCE Object.
A summary QC report and a supplemental cell type report are prepared and exported.
Finally, all SCE files are converted to AnnData format and exported.
Panels B-G show abbreviated versions of figures that appear in the summary QC report, shown here for SCPCL000001[33], as follows:
B. The total UMI count for each cell in the Unfiltered SCE Object, ordered by rank.
Points are colored by the percentage of cells that pass the empty droplets filter.
C. The number of genes detected in each cell passing the empty droplets filter against the total UMI count.
Points are colored by the percentage of mitochondrial reads in the cell.
D. miQC model diagnostic plot showing the percent of mitochondrial reads in each cell against the number of genes detected in the Filtered SCE Object.
Points are colored by the probability that the cell is compromised as determined by miQC.
E. The percent of mitochondrial reads in each cell against the number of genes detected in each cell.
Points are colored by whether the cell was kept or removed, as determined by both miQC and a minimum unique gene count cutoff, prior to normalization and dimensionality reduction.
F. UMAP embeddings of log-normalized RNA expression values where each cell is colored by the number of genes detected.
G. UMAP embeddings of log-normalized RNA expression values for the top four most variable genes, colored by the given gene’s expression.
In the actual summary QC report, the top 12 most highly variable genes are shown.
H. File download structure for an ScPCA Portal project download in SingleCellExperiment (SCE) format.
The download folder is named according to the project ID, data format, and the date it was downloaded.
Download folders contain a folder for all single-cell data, _single-cell.
This folder contains a folder for each sample ID, each containing the three versions (unfiltered, filtered, and processed) of the expression data as well as the summary QC report and cell type report all named according to the ScPCA library ID.
The single-cell_metadata.tsv file contains sample metadata for all samples included in the download.
The README.md file provides information about the contents of each download file, additional contact and citation information, and terms of use for data downloaded from the ScPCA Portal.
The folder _bulk is only present for projects that also have bulk RNA-Seq data.
It contains a gene-by-sample matrix of raw gene expression as quantified by salmon and associated metadata for all samples with bulk RNA-Seq data.
I. File download structure for an ScPCA Portal merged project download in SCE format.
The download folder is named according to the project ID, data format, and the date it was downloaded.
Download folders contain a folder for all single-cell data, _single-cell_merged.
This folder contains a single merged object containing all samples in the given project and a summary report briefly detailing the contents of the merged object.
All summary QC and cell type reports for each individual library are also provided in the individual_reports folder arranged by their sample ID.
As in panel (H), additional files single-cell_metadata.tsv, _bulk_quant.tsv, _bulk_metadata.tsv, and README.md are also included.
Figure 3:Consensus cell type annotation in scpca-nf.
A. Expanded view of the process for adding cell type annotations within scpca-nf, as introduced in Figure 2A.
Cell type annotation is performed on the Processed SCE Object.
A celldex[49] reference dataset with ontology labels is used as input for annotation with SingleR[49], a list of marker genes compiled from PanglaoDB[84] is used as input for annotation with CellAssign[50], and the SCimilarity foundation model is used as input for annotation with SCimilarity[51].
Results from these automated cell type annotation methods and a consensus cell type annotation are then added to the Processed SCE Object.
A cell type summary report with information about reference sources, comparisons among cell type annotation methods, and diagnostic plots is created.
Although not shown in this panel, cell type annotations are also included in the Processed AnnData Object created from the Processed SCE Object (Figure 2A).
B. Diagram of ontology-aware consensus cell type annotation performed in scpca-nf, using T cell annotation as an example.
The numbers in parentheses indicate the number of descendants for each cell type in the Cell Ontology.
We perform pairwise comparisons among cell type annotations made by SingleR, CellAssign, and SCimilarity.
For each pair of annotations, we identify the annotated cell types’ latest common ancestor based on the Cell Ontology.
We then identify the consensus cell type as the latest common ancestor with the fewest descendants, indicated with the black check mark.
C. Example heatmap as shown in the cell type summary report comparing the consensus cell type annotations to automated annotations assigned by SingleR, CellAssign, and SCimilarity.
Heatmap cells are colored by the Jaccard similarity index.
A value of 1 means that there is complete overlap between which cells are annotated with the two labels being compared, and a value of 0 means that there is no overlap between which cells are annotated with the two labels being compared.
The heatmap shown is for library SCPCL000001.
For this figure specifically, the heatmap shows only the top seven consensus cell type annotations with at least three cells, but the heatmap in the cell type summary report shows all cell types.
Figure 4:Consensus cell type annotations in brain and CNS tumors.
A. Dot plot showing expression of cell-type-specific marker genes across all libraries from brain and central nervous system (CNS) tumors, excluding multiplexed libraries.
Expression is shown for each broad cell type annotation, where each broad cell type annotation is a collection of similar consensus cell type annotations.
The y-axis displays the broad consensus cell type observed across libraries, with the total number of cells indicated in parentheses.
The x-axis displays marker genes, determined by CellMarker 2.0[87], used for consensus cell type validation for each cell type shown along the top annotation bar.
Dots are colored by mean gene expression across libraries and sized proportionally to the percent of libraries they are observed in, out of all cells with the same broad cell type annotation in brain and CNS tumor libraries.
A maximum of 10 cell type marker genes are shown for each broad cell type annotation.
Only broad cell type annotations that appear in at least 50 cells across samples in the given diagnosis group are shown.
B. Barplot showing the percentage of each broad consensus cell type annotation across libraries of brain and CNS tumors, separated into high-grade (top panel) and low-grade (bottom panel) glioma diagnoses for non-multiplexed libraries from patient tissue samples.
C. Barplot showing all consensus cell types classified as immune cells across libraries of brain and CNS tumors, separated into high-grade (top panel) and low-grade (bottom panel) glioma diagnoses for non-multiplexed libraries.
The percentage shown corresponds to the percentage of immune cells classified as the indicated consensus cell type.
Only libraries comprised of at least 1% immune cells, based on consensus cell type annotations, are shown.
Specific consensus cell types for myeloid and lymphocyte immune cells are shown, with all other consensus immune cell types included in “other.”
Any myeloid or lymphocyte immune cell types with fewer than 1000 cells across all libraries are also included in “other”.
D. Dot plot showing expression of cell-type-specific marker genes across all non-multiplexed libraries from brain and CNS tumors, considering only immune cells.
Expression is shown for each consensus cell type annotation.
The y-axis displays the consensus cell type observed across libraries, with the total number of cells indicated in parentheses.
The x-axis displays marker genes, determined by CellMarker 2.0[87], used for consensus cell type validation for each cell type shown along the top annotation bar.
Dots are colored by mean gene expression across libraries and sized proportionally to the percent of libraries they are observed in, out of all cells with the same consensus cell type annotation in brain and CNS tumor libraries.
A maximum of 10 cell type marker genes are shown for each consensus cell type annotation.
Only broad cell type annotations that appear in at least 50 cells across samples in the given diagnosis group are shown.
Cell types without associated marker genes in CellMarker 2.0 are not shown, including lymphocyte of B lineage, mature T cell, mature alpha-beta T cell, alpha-beta T cell, myeloid leukocyte, and tissue-resident macrophage.
Figure 5:Cell type annotation and CNV inference on neuroblastoma samples.
A. UMAP highlighting cell type annotations made with the OpenScPCA Project, collapsed into broad annotation groups, for all libraries in the neuroblastoma-only ScPCA Project SCPCP000004 (N = 42).
The UMAP was constructed from the merged SCPCP000004 object such that all libraries contribute an equal weight, but no batch correction was performed.
B. UMAP highlighting total per-cell CNV events as calculated with InferCNV[52] for all libraries in the neuroblastoma-only ScPCA Project SCPCP000004 (N = 42).
The UMAP was constructed from the merged SCPCP000004 object such that all libraries contribute an equal weight, but no batch correction was performed.
The total per-cell CNV values were calculated by summing the total number of chromosome arms with a CNV event, as estimated by the i6 HMM in InferCNV.
Gray cells are from libraries excluded from InferCNV inference because they did not contain enough normal cells to define the InferCNV reference baseline.
C. Heatmap displaying per-cell CNV events across chromosomes with canonical neuroblastoma alterations [65,66,67] for a single library, SCPCL000130.
Each cell in SCPCL000130 is represented by two adjacent rows, the first indicating the presence or absence of copy-number gain and the second indicating the presence or absence of copy-number loss.
The heatmap is grouped by chromosome arm and OpenScPCA Project cell type annotation, where “normal” cells comprise all characterized non-malignant cells.
This library exhibits strong signatures of canonical neuroblastoma alterations including 1p loss, 11q loss, and 17q gain.
D. Example ridge plot as shown in the summary QC report showing per-cell total CNV distributions across the top seven consensus cell type annotations.
All additional consensus cell types are shown with the “all remaining cell types” category.
The ridge plot shown is for library SCPCL000130.
Figure 6:Comparison of bulk and pseudobulk modalities.
A. Scatter plots colored by point density of DESeq2-transformed and normalized bulk RNA-seq expression compared to pseudobulk expression from single-cell/nuclei RNA-seq.
Samples with RNA-seq for both bulk and single-cell/nuclei modalities, excluding multiplexed samples, from ScPCA projects comprising brain and central nervous system tumors are shown, with the number of samples considered per project shown in parentheses.
The regression line is also shown for each project.
Results from additional projects are shown in Figure S7A.
B. Odds ratios from overrepresentation analysis for the same samples shown in panel A, colored by FDR-corrected significance.
Each odds ratio represents the odds that marker genes for the given cell type were overrepresented in bulk RNA-seq when compared to single-cell/nuclei RNA-seq, relative to other genes.
A total of 68 cell types were evaluated for each project shown here.
Results from additional projects are shown in Figure S7B.
Supplementary Figures and Tables
Table S1. Overview of ScPCA Portal Datasets.
This table provides descriptions and sample and library counts for each project in the ScPCA Portal.
scpca_project_id: ScPCA project unique identifier.
Diagnosis group: Diagnosis group as shown in Figure 1A.
Diagnoses: Full set of diagnoses for all samples associated with the project.
Total number of samples (S): Number of samples associated with the project.
Total number of libraries (L): Number of libraries associated with the project.
Due to additional sequencing modalities and/or multiplexing, projects may have more libraries than samples.
All remaining columns give the number of libraries (as designated with (L)) with the given suspension type, 10x kit version, or additional modality.
Table S2. Summary of references used for cell type annotation with CellAssign.
This table provides a summary of the references used for assigning cell types for ScPCA projects using CellAssign.
All references were built using all cell types from a specified set of organs present in PanglaoDB’s marker gene list.
scpca_project_id: ScPCA project unique identifier.
Diagnoses: Full set of diagnoses for all samples associated with the project.
ScPCA reference name: Name used to describe the custom reference.
PanglaoDB organs included in reference: A list of all organs included in the reference with names of organs corresponding to organs listed in PanglaoDB.
The reference includes marker genes for all cell types present in each organ.
Figure S1:Results from benchmarking alevin-fry and CellRanger performance.
Each panel compares metrics for six ScPCA libraries, including three single-cell and three single-nuclei suspensions, obtained from processing libraries with salmon alevin and alevin-fry or CellRanger.
Results shown were generated with CellRanger v6.1.2 using default parameters for single-cell libraries and use of the --include_introns flag to include intronic reads for single-nuclei libraries only.
All libraries were processed with salmon alevin v1.5.2 and alevin-fry v0.4.1 using an index containing both spliced and unspliced cDNA as mentioned in the Methods.
The libraries used for benchmarking were randomly chosen.
A. Runtime in minutes (top row) and peak memory in GB (bottom row) for six ScPCA libraries processed with alevin-fry and CellRanger.
Processing with alevin-fry was consistently faster and more memory-efficient compared to processing with CellRanger.
Panels B-D show only cells present in both the alevin-fry and CellRanger output.
B. Comparison of mean gene expression values for six ScPCA libraries processed with alevin-fry and CellRanger, shown on a log-scale.
Each point is a gene, and only genes detected in at least 5 cells are shown.
\(R^2\) values shown in the top left corner of each panel reflect broad agreement in mean gene expression values between platforms.
C. Comparison of log total UMI counts for six ScPCA libraries processed with alevin-fry and CellRanger.
Distributions reflect broad agreement in the total UMI count per cell between platforms, although alevin-fry returned slightly higher values for certain single-cell libraries.
D. Comparison of log total genes detected per cell for six ScPCA libraries processed with alevin-fry and CellRanger.
Distributions reflect broad agreement between platforms in the total number of genes detected per cell between platforms, although alevin-fry returned slightly higher values for certain single-cell libraries.
Figure S2:Processing additional single-cell modalities in scpca-nf.
A. Overview of the scpca-nf workflow for processing libraries with CITE-seq or antibody-derived tag (ADT) data.
The workflow mirrors that shown in Figure 2A with several differences accounting for the presence of ADT data.
First, both an RNA and ADT FASTQ file are required as input to alevin-fry, along with a TSV file containing information about ADT barcodes.
The gene-by-cell and ADT-by-cell count matrices are produced and read into R to create a SingleCellExperiment (SCE) object.
Second, during post-processing, statistics are calculated to filter cells based on ADT counts, but the filter is not applied.
ADT counts are also normalized and included in the Processed SCE Object.
Third, the summary QC report will include a CITE-seq section with additional information about ADT-level processing.
Fourth, the workflow exports SCE objects containing both RNA and ADT results, while separate AnnData objects for RNA and ADT are exported.
Panels B-D show example figures that appear in the CITE-seq section of the summary QC report, shown here for SCPCL000290.
B. The percent of mitochondrial reads in each cell against the number of genes detected in each cell.
The panel labeled “Keep” displays cells that are retained based on both RNA and ADT counts.
The panel labeled “Filter (ADT only)” displays cells that are filtered based on only ADT counts.
The panel labeled “Filter (RNA only)” displays cells that are filtered based on only RNA counts.
The panel labeled “Filter (RNA & ADT)” panel displays cells that are filtered based on both RNA and ADT counts.
C. Density plots of the log-normalized ADT counts shown for the four most variable ADTs in the library.
D. UMAP embeddings of log-normalized RNA expression values where each cell is colored by the expression of the given highly-variable ADT.
E. Overview of the scpca-nf workflow for multiplexed libraries.
The workflow mirrors that shown in Figure 2A with several differences accounting for the presence of multiplexed data.
First, both an RNA and HTO FASTQ file are required as input to alevin-fry, along with a TSV file providing information about library pools.
The gene-by-cell and HTO-by-cell count matrices are produced and read into R to create a SingleCellExperiment (SCE) object.
Second, in parallel, the RNA FASTQ file, the HTO FASTQ file, and, if available, a corresponding Bulk RNA FASTQ file for each sample present in the multiplexed library are provided to a demultiplexing subprocess.
The workflow calculates demultiplexing results based on HTO counts, as well as genetic demultiplexing results if the library has corresponding bulk RNA FASTQ files.
Demultiplexing results are stored in all exported SCE objects (Unfiltered, Filtered, and Processed), but libraries themselves are not demultiplexed.
Third, only SCE files are provided for multiplexed libraries; no corresponding AnnData files are provided.
Figure S3:Processing other sequencing modalities and merging objects with scpca-nf.
A. Overview of the bulk RNA-Seq workflow.
A set of FASTQ files from libraries sequenced with bulk RNA-seq are provided as input.
Reads are trimmed using fastp, and salmon is used to map reads and quantify counts.
The quantified gene expression files output from salmon are then grouped by ScPCA Project ID, and a sample-by-gene count matrix is exported for each project in TSV format.
B. Overview of the spatial transcriptomics workflow.
The FASTQ file and tissue image for a given library are provided as input to spaceranger.
The workflow directly returns the results from running spaceranger without any further processing.
C. Overview of the merged workflow.
Processed SCE objects associated with a given project are merged into a single object, including ADT counts from CITE-seq data if present, and a merged summary report is generated.
Merged objects are available for download either in SCE or AnnData format.
D. Example of UMAPs as shown in the merged summary report.
A grid of UMAPs is shown for each library in the merged object, with cells in the library of interest shown in red and cells belonging to other libraries shown in gray.
The UMAP was constructed from the merged object such that all libraries contribute an equal weight, but no batch correction was performed.
The libraries pictured are a subset of libraries in the ScPCA project SCPCP000003.
For this figure specifically, the merged UMAP was constructed from a merged object containing only these four libraries, but the merged object and summary report on the ScPCA Portal for SCPCP000003 contain all of this project’s libraries.
Figure S4:Ontology-aware consensus cell type assignment provides harmonized labels for cells.
A. UMAP highlighting cells annotated as types of T cells with SingleR, CellAssign, SCimilarity as well as the associated consensus cell types for the library SCPCL000049.
All other cells are shown in gray.
This UMAP specifically shows the top three T cell types for each cell type assignment, with remaining T cell types grouped together as “other T cells.”
B. UMAP showing the top seven consensus cell types in SCPCL0000049.
All additional consensus cell types are included in the “all remaining cell types” category.
C. UMAP showing total per-cell CNV events for SCPCL0000049.
The total per-cell CNV values were calculated by summing the total number of chromosome arms with a CNV event, as estimated by the i6 HMM in InferCNV[52].
Figure S5:Consensus cell type annotation gene expression in other diagnosis groups.
Dot plots showing expression of cell-type-specific marker genes across all libraries from Leukemia (A), Sarcoma (B), and Other solid tumors (C) diagnosis groups.
Expression is shown for each broad cell type annotation, where each broad cell type annotation is a collection of similar consensus cell type annotations.
The y-axis displays the broad consensus cell type observed across libraries, with the total number of cells indicated in parentheses.
The x-axis displays marker genes, determined by CellMarker 2.0[87], used for consensus cell type validation for each cell type shown along the top annotation bar.
Dots are colored by mean gene expression across libraries and sized proportionally to the percent of libraries they are observed in, out of all cells with the same broad cell type annotation in the given diagnosis.
A maximum of 10 cell type marker genes are shown for each broad cell type annotation.
Only broad cell type annotations that appear in at least 50 cells across samples in the given diagnosis group are shown.
Cell types without associated marker genes in CellMarker 2.0 are not shown, including pigment cell for Sarcoma (B) and pigment cell and kidney cell for Other solid tumors (C).
Figure S6:Consensus cell type annotation distributions in other diagnosis groups.
Barplots of the percentage of cells annotated as each broad consensus cell type annotation across all libraries from Leukemia (A), Sarcoma (B), and Other solid tumors (C) diagnosis groups.
Within each panel, libraries are shown grouped by diagnosis.
Each column represents the distribution of cell types within a single library.
Only non-multiplexed libraries from patient tissue samples are shown.
Figure S7:Comparison of bulk and pseudobulk modalities for additional projects.
A. Scatter plots colored by point density of DESeq2-transformed and normalized bulk RNA-seq expression compared to pseudobulk expression from single-nuclei RNA-seq.
Projects with RNA-seq for both bulk and single-cell/nuclei modalities that are not displayed in Figure 6A are shown.
All samples shown here are single-nuclei, and the number of samples considered per project is shown in parentheses.
The regression line is also shown for each project.
B. Odds ratios from overrepresentation analysis for the same samples shown in panel A, colored by FDR-corrected significance.
Each odds ratio represents the odds that marker genes for the given cell type were overrepresented in the bulk modality, relative to other genes.
44 cell types were evaluated for project SCPCP000006, and 50 cell types were evaluated for project SCPCP000017.
References
1.
Exponential scaling of single-cell RNA-seq in the past decade
Valentine Svensson, Roser Vento-Tormo, Sarah A Teichmann
Single-cell RNA-seq highlights intratumoral heterogeneity in primary glioblastoma
Anoop P Patel, Itay Tirosh, John J Trombetta, Alex K Shalek, Shawn M Gillespie, Hiroaki Wakimoto, Daniel P Cahill, Brian V Nahed, William T Curry, Robert L Martuza, … Bradley E Bernstein
cellxgene: a performant, scalable exploration platform for high dimensional sparse matrices
Colin Megill, Bruce Martin, Charlotte Weaver, Sidney Bell, Lia Prins, Seve Badajoz, Brian McCandless, Angela Oliveira Pisco, Marcus Kinsella, Fiona Griffin, … Ambrose Carr
Aviv Regev, Sarah A Teichmann, Eric S Lander, Ido Amit, Christophe Benoist, Ewan Birney, Bernd Bodenmiller, Peter Campbell, Piero Carninci, Menna Clatworthy, …
The Human Tumor Atlas Network: Charting Tumor Transitions across Space and Time at Single-Cell Resolution
Orit Rozenblatt-Rosen, Aviv Regev, Philipp Oberdoerffer, Tal Nawy, Anna Hupalowska, Jennifer E Rood, Orr Ashenberg, Ethan Cerami, Robert J Coffey, Emek Demir, … Xiaowei Zhuang
Orchestrating single-cell analysis with Bioconductor
Robert A Amezquita, Aaron TL Lun, Etienne Becht, Vince J Carey, Lindsay N Carpp, Ludwig Geistlinger, Federico Marini, Kevin Rue-Albrecht, Davide Risso, Charlotte Soneson, … Stephanie C Hicks
NCBI Taxonomy: a comprehensive update on curation, resources and tools
Conrad L Schoch, Stacy Ciufo, Mikhail Domrachev, Carol L Hotton, Sivakumar Kannan, Rogneda Khovanskaya, Detlef Leipe, Richard Mcveigh, Kathleen O’Neill, Barbara Robbertse, … Ilene Karsch-Mizrachi
Mondo: Unifying diseases for the world, by the world
Nicole A Vasilevsky, Nicolas A Matentzoglu, Sabrina Toro, Joseph E Flack IV, Harshad Hegde, Deepak R Unni, Gioconda F Alyea, Joanna S Amberger, Larry Babb, James P Balhoff, … Melissa A Haendel
Unification of multi-species vertebrate anatomy ontologies for comparative biology in Uberon
Melissa A Haendel, James P Balhoff, Frederic B Bastian, David C Blackburn, Judith A Blake, Yvonne Bradford, Aurelie Comte, Wasila M Dahdul, Thomas A Dececchi, Robert E Druzinsky, … Christopher J Mungall
A standardized framework for representation of ancestry data in genomics studies, with application to the NHGRI-EBI GWAS Catalog
Joannella Morales, Danielle Welter, Emily H Bowler, Maria Cerezo, Laura W Harris, Aoife C McMahon, Peggy Hall, Heather A Junkins, Annalisa Milano, Emma Hastings, … Jacqueline AL MacArthur
The myogenesis program drives clonal selection and drug resistance in rhabdomyosarcoma
Anand G Patel, Xiang Chen, Xin Huang, Michael R Clay, Natalia L Komarova, Matthew J Krasin, Alberto Pappo, Heather Tillman, Brent A Orr, Justina McEvoy, … Michael A Dyer
Tumor type and cell type-specific gene expression alterations in diverse pediatric central nervous system tumors identified using single nuclei RNA-seq
Min Kyung Lee, Nasim Azizgolshani, Joshua Shapiro, Lananh Nguyen, Fred Kolling IV, George Zanazzi, Hildredth Frost, Brock Christensen
Hydroxymethylation alterations in progenitor-like cell types of pediatric central nervous system tumors are associated with cell type-specific transcriptional changes
Min Kyung Lee, Nasim Azizgolshani, Ze Zhang, Laurent Perreard, Fred Kolling IV, Lananh Nguyen, George Zanazzi, Lucas Salas, Brock Christensen
Orthotopic patient-derived xenografts of paediatric solid tumours
Elizabeth Stewart, Sara M Federico, Xiang Chen, Anang A Shelat, Cori Bradley, Brittney Gordon, Asa Karlstrom, Nathaniel R Twarog, Michael R Clay, Armita Bahrami, … Michael A Dyer
Retinoblastoma from human stem cell-derived retinal organoids
Jackie L Norrie, Anjana Nityanandam, Karen Lai, Xiang Chen, Matthew Wilson, Elizabeth Stewart, Lyra Griffiths, Hongjian Jin, Gang Wu, Brent Orr, … Michael A Dyer
Tumor and immune cell types interact to produce heterogeneous phenotypes of pediatric high-grade glioma
John DeSisto, Andrew M Donson, Andrea M Griesinger, Rui Fu, Kent Riemondy, Jean Mulcahy Levy, Julie A Siegenthaler, Nicholas K Foreman, Rajeev Vibhakar, Adam L Green
Single-cell transcriptional mapping reveals genetic and non-genetic determinants of aberrant differentiation in AML
Andy GX Zeng, Ilaria Iacobucci, Sayyam Shah, Amanda Mitchell, Gordon Wong, Suraj Bansal, David Chen, Qingsong Gao, Hyerin Kim, James A Kennedy, … John E Dick
The NCBI dbGaP database of genotypes and phenotypes
Matthew D Mailman, Michael Feolo, Yumi Jin, Masato Kimura, Kimberly Tryka, Rinat Bagoutdinov, Luning Hao, Anne Kiang, Justin Paschall, Lon Phan, … Stephen T Sherry
UCSC Cell Browser: visualize your single-cell data
Matthew L Speir, Aparna Bhaduri, Nikolay S Markov, Pablo Moreno, Tomasz J Nowakowski, Irene Papatheodorou, Alex A Pollen, Brian J Raney, Lucas Seninge, WJames Kent, Maximilian Haeussler
Empowering bioinformatics communities with Nextflow and nf-core
Björn E Langer, Andreia Amaral, Marie-Odile Baudement, Franziska Bonath, Mathieu Charles, Praveen Krishna Chitneedi, Emily L Clark, Paolo Di Tommaso, Sarah Djebali, Philip A Ewels, … the nf-core community
Massively parallel digital transcriptional profiling of single cells
Grace XY Zheng, Jessica M Terry, Phillip Belgrader, Paul Ryvkin, Zachary W Bent, Ryan Wilson, Solongo B Ziraldo, Tobias D Wheeler, Geoff P McDermott, Junjie Zhu, … Jason H Bielas
Bioconductor: open software development for computational biology and bioinformatics
Robert C Gentleman, Vincent J Carey, Douglas M Bates, Ben Bolstad, Marcel Dettling, Sandrine Dudoit, Byron Ellis, Laurent Gautier, Yongchao Ge, Jeff Gentry, … Jianhua Zhang
Orchestrating high-throughput genomic analysis with Bioconductor
Wolfgang Huber, Vincent J Carey, Robert Gentleman, Simon Anders, Marc Carlson, Benilton S Carvalho, Hector Corrada Bravo, Sean Davis, Laurent Gatto, Thomas Girke, … Martin Morgan
miQC: An adaptive probabilistic framework for quality control of single-cell RNA-sequencing data
Ariel A Hippen, Matias M Falco, Lukas M Weber, Erdogan Pekcan Erkan, Kaiyang Zhang, Jennifer Anne Doherty, Anna Vähärautio, Casey S Greene, Stephanie C Hicks
Reference-based analysis of lung single-cell sequencing reveals a transitional profibrotic macrophage
Dvir Aran, Agnieszka P Looney, Leqian Liu, Esther Wu, Valerie Fong, Austin Hsu, Suzanna Chak, Ram P Naikawadi, Paul J Wolters, Adam R Abate, … Mallar Bhattacharya
Probabilistic cell-type assignment of single-cell RNA-seq for tumor microenvironment profiling
Allen W Zhang, Ciara O’Flanagan, Elizabeth A Chavez, Jamie LP Lim, Nicholas Ceglia, Andrew McPherson, Matt Wiens, Pascale Walters, Tim Chan, Brittany Hewitson, … Sohrab P Shah
The Cell Ontology 2016: enhanced content, modularization, and ontology interoperability
Alexander D Diehl, Terrence F Meehan, Yvonne M Bradford, Matthew H Brush, Wasila M Dahdul, David S Dougall, Yongqun He, David Osumi-Sutherland, Alan Ruttenberg, Sirarat Sarntivijai, … Christopher J Mungall
Genomic Landscape of Ewing Sarcoma Defines an Aggressive Subtype with Co-Association of
<i>STAG2</i>
and
<i>TP53</i>
Mutations
Franck Tirode, Didier Surdez, Xiaotu Ma, Matthew Parker, Marie Cécile Le Deley, Armita Bahrami, Zhaojie Zhang, Eve Lapouble, Sandrine Grossetête-Lalami, Michael Rusch, … Olivier Delattre
Systematic comparison of single-cell and single-nucleus RNA-sequencing methods
Jiarui Ding, Xian Adiconis, Sean K Simmons, Monika S Kowalczyk, Cynthia C Hession, Nemanja D Marjanovic, Travis K Hughes, Marc H Wadsworth, Tyler Burks, Lan T Nguyen, … Joshua Z Levin
Dissociation protocols used for sarcoma tissues bias the transcriptome observed in single-cell and single-nucleus RNA sequencing
Danh D Truong, Salah-Eddine Lamhamedi-Cherradi, Robert W Porter, Sandhya Krishnan, Jyothishmathi Swaminathan, Amber Gibson, Alexander J Lazar, JAndrew Livingston, Vidya Gopalakrishnan, Nancy Gordon, … Joseph A Ludwig
Petr Danecek, James K Bonfield, Jennifer Liddle, John Marshall, Valeriu Ohan, Martin O Pollard, Andrew Whitwham, Thomas Keane, Shane A McCarthy, Robert M Davies, Heng Li
Effective methods for bulk RNA-seq deconvolution using scnRNA-seq transcriptomes
Francisco Avila Cobos, Mohammad Javad Najaf Panah, Jessica Epps, Xiaochen Long, Tsz-Kwong Man, Hua-Sheng Chiu, Elad Chomsky, Evgeny Kiner, Michael J Krueger, Diego di Bernardo, … Pavel Sumazin
The children's brain tumor network (CBTN) - Accelerating research in pediatric central nervous system tumors through collaboration and open science
Jena V Lilly, Jo Lynne Rokita, Jennifer L Mason, Tatiana Patton, Stephanie Stefankiewiz, David Higgins, Gerri Trooskin, Carina A Larouci, Kamnaa Arya, Elizabeth Appert, … Angela J Waanders
Joshua A Shapiro, Krutika S Gaonkar, Stephanie J Spielman, Candace L Savonen, Chante J Bethell, Run Jin, Komal S Rathi, Yuankun Zhu, Laura E Egolf, Bailey K Farrow, … Jaclyn N Taroni
An integrated single-cell RNA-seq map of human neuroblastoma tumors and preclinical models uncovers divergent mesenchymal-like gene expression programs
Richard H Chapple, Xueying Liu, Sivaraman Natarajan, Margaret IM Alexander, Yuna Kim, Anand G Patel, Christy W LaFlamme, Min Pan, William C Wright, Hyeong-Min Lee, … Paul Geeleher